Stocks making new lows - interpreting bearish signals and opportunities
The observation that stocks are making new lows is a critical data point in technical analysis and market psychology. When a stock price drops to a new low relative to previous days, weeks, or even months, it may suggest a variety of market conditions—from sustained bearish momentum to a potential setup for value-seeking investors. Understanding the significance of new lows is essential for traders, long-term investors, and market strategists alike.

newlows
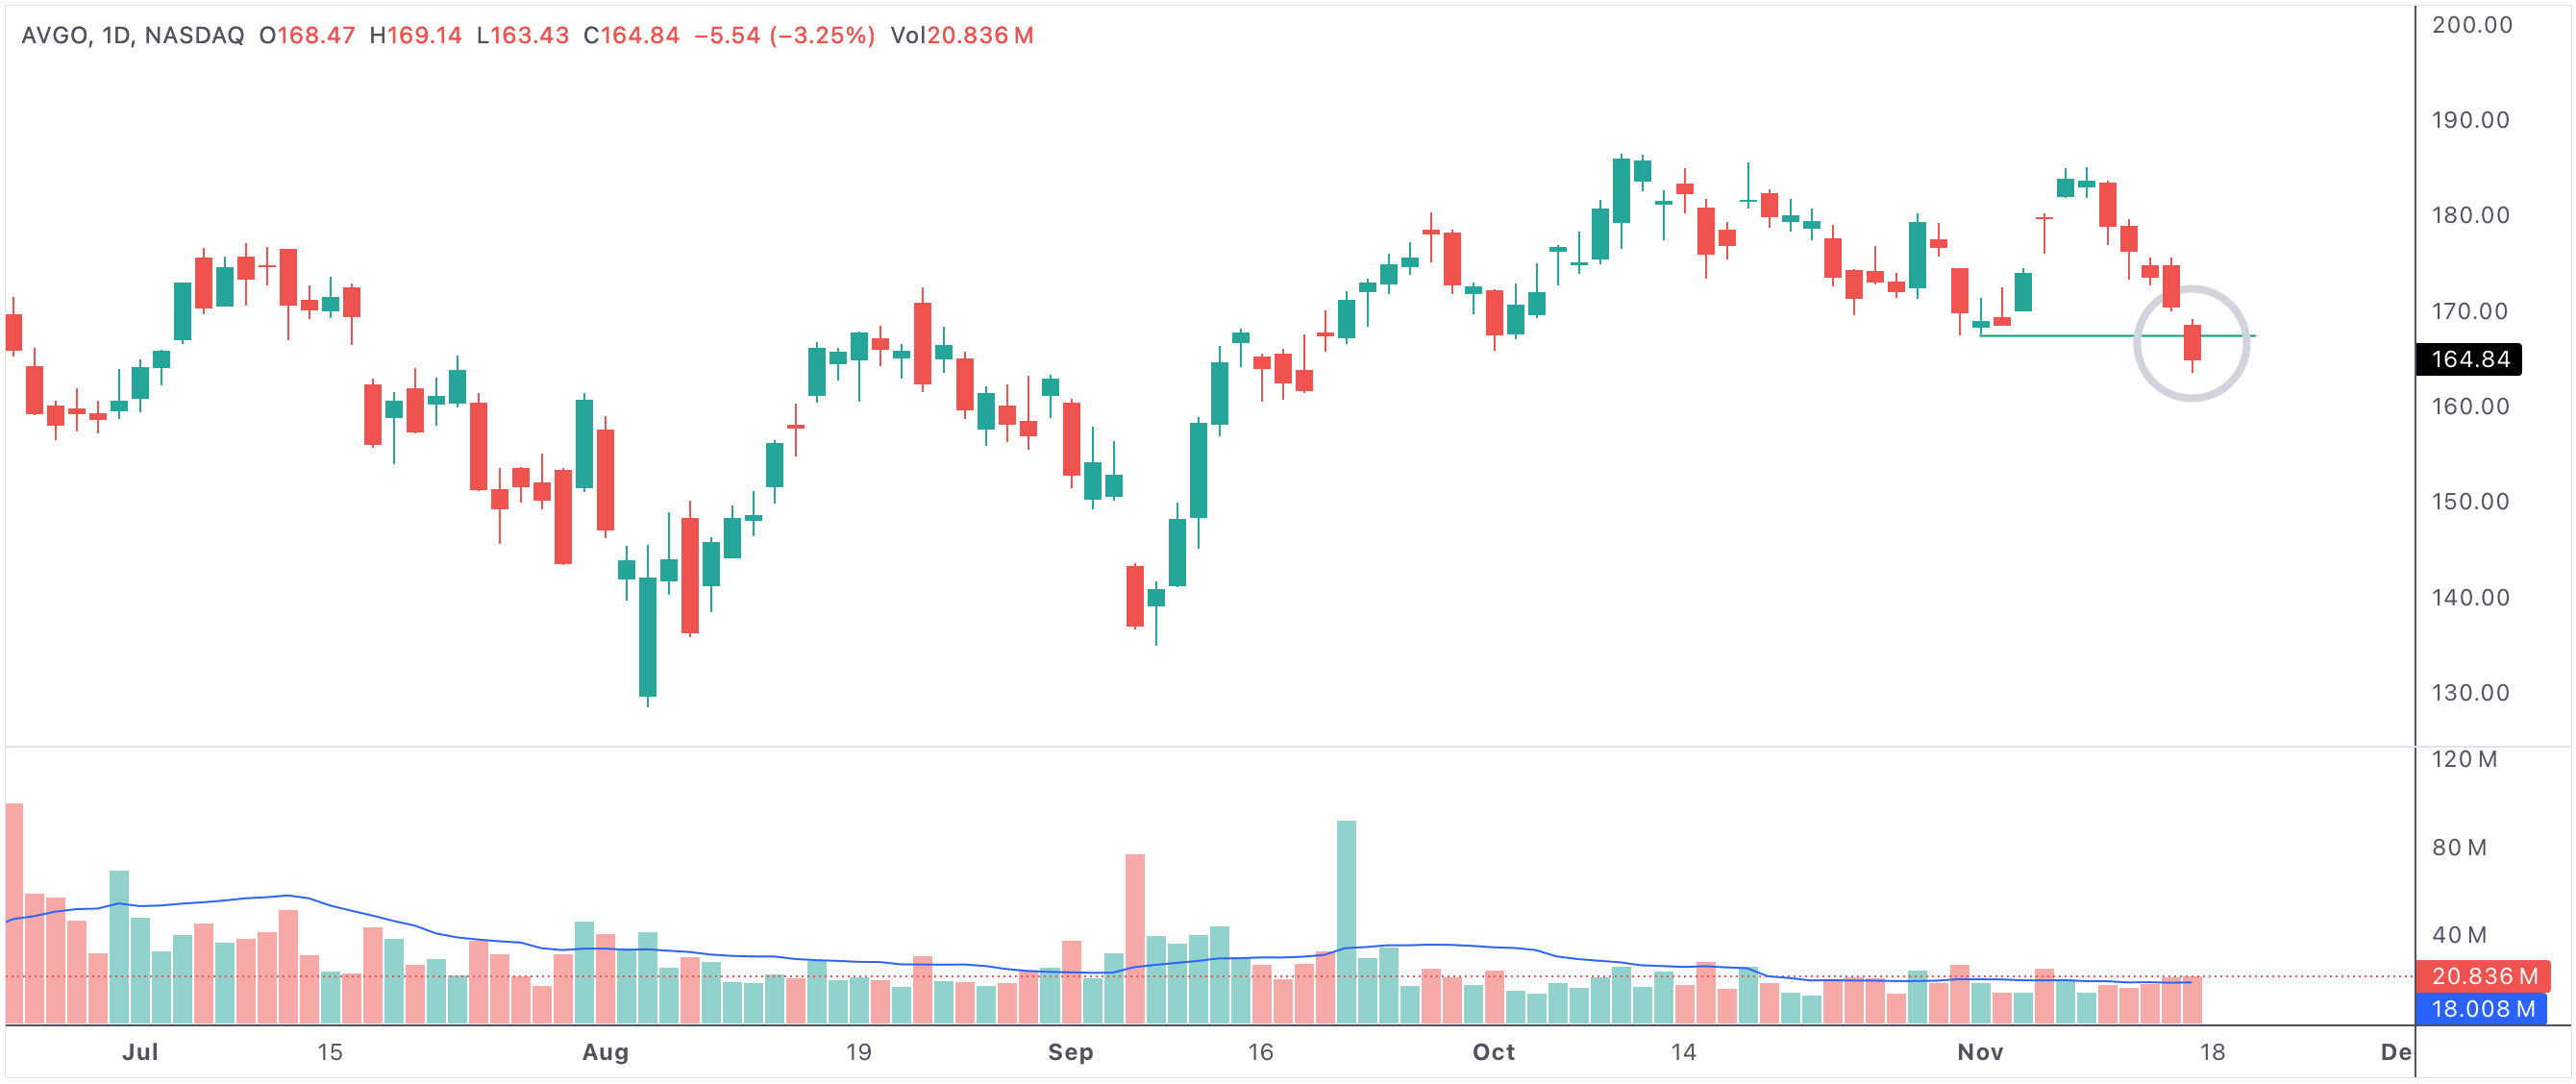
An example of a stock making a new low compared to prior sessions
Stocks making new lows
What Does It Mean When a Stock Makes a New Low?
A stock making a new low refers to its price dropping below the lowest point seen over a defined period—often five, ten, or twenty days. This condition often attracts the attention of market participants because it typically indicates ongoing selling pressure and a lack of immediate buyer support. New lows can reflect company-specific concerns, sector weaknesses, or broader macroeconomic challenges.
In many cases, repeated new lows serve as a bearish signal, suggesting that investors are eager to exit positions and that confidence in the stock is waning. As a stock breaks through prior support levels, it can trigger further selling by technical traders, stop-loss orders, or even algorithmic strategies designed to capitalize on downward momentum.
Bearish Implications of Consecutive New Lows
For traders and investors who favor trend-following strategies, stocks making consecutive new lows can confirm the presence of a bearish trend. This pattern often suggests that underlying fundamentals or market sentiment are deteriorating. In such environments, institutional investors may reduce exposure, while retail investors may grow increasingly cautious. If new lows coincide with negative earnings reports, poor guidance, or adverse economic news, the bearish interpretation is reinforced.
- New lows confirm a weakening trend and can signal additional downside risk.
- This condition may attract short sellers or discourage new buying interest.
- If multiple stocks in an index make new lows simultaneously, it can suggest broader market stress.
- Failure to recover quickly from new lows may indicate deep-seated issues or lack of investor confidence.
Potential Bullish Opportunities
Not all investors see new lows as purely negative. For value investors and contrarians, a stock hitting a new low may represent a rare opportunity. These investors look for signs that the selling has become excessive or that the market is overreacting to short-term concerns. Key signals include:
- Stable or improving fundamentals despite declining price
- Insider buying or institutional accumulation at lower levels
- Strong support from long-term moving averages or historical price zones
- Positive divergence on momentum indicators like RSI or MACD
If buying emerges near new lows, it can trigger a sharp reversal or at least a relief rally, especially if broader market conditions are not deteriorating.
Context Matters: Macro Environment and Technical Levels
The significance of stocks making new lows must always be considered in light of the broader context. In a bear market or during periods of economic uncertainty, new lows may be more likely to lead to further declines. In contrast, during bull markets or periods of economic recovery, new lows in individual stocks may simply reflect temporary dislocation or sector rotation, rather than systemic risk.
Technical analysts also watch for how stocks behave at key support levels. If a stock makes a new low but rapidly recovers, it may signal the exhaustion of sellers and the start of a new uptrend. However, a failure to hold these levels can confirm the need for additional caution.
Summary: New Lows as a Decision Point
Stocks making new lows offer important signals for traders and investors. They may highlight persistent weakness and caution, but also present rare opportunities for those looking to capitalize on overdone selling. The most successful market participants analyze both technical signals and broader economic context, using new lows as a cue to adjust their strategies and risk management. Whether viewed as a warning or an invitation, new lows remain one of the most watched patterns in the world of technical analysis.