Stocks showing a bearish divergence with the RSI warn of trend reversal

Bearish divergence with the Relative Strength Index (RSI) is one of the most widely watched technical signals in stock trading. This condition develops when stock prices reach new highs but the RSI—a popular momentum indicator—fails to confirm, forming lower highs. Such divergence between price and RSI reveals that while price is climbing, underlying buying momentum is fading, and this often serves as a crucial warning of an impending reversal or trend exhaustion.

A bearish divergence occurs when the price goes higher while the RSI moves lower
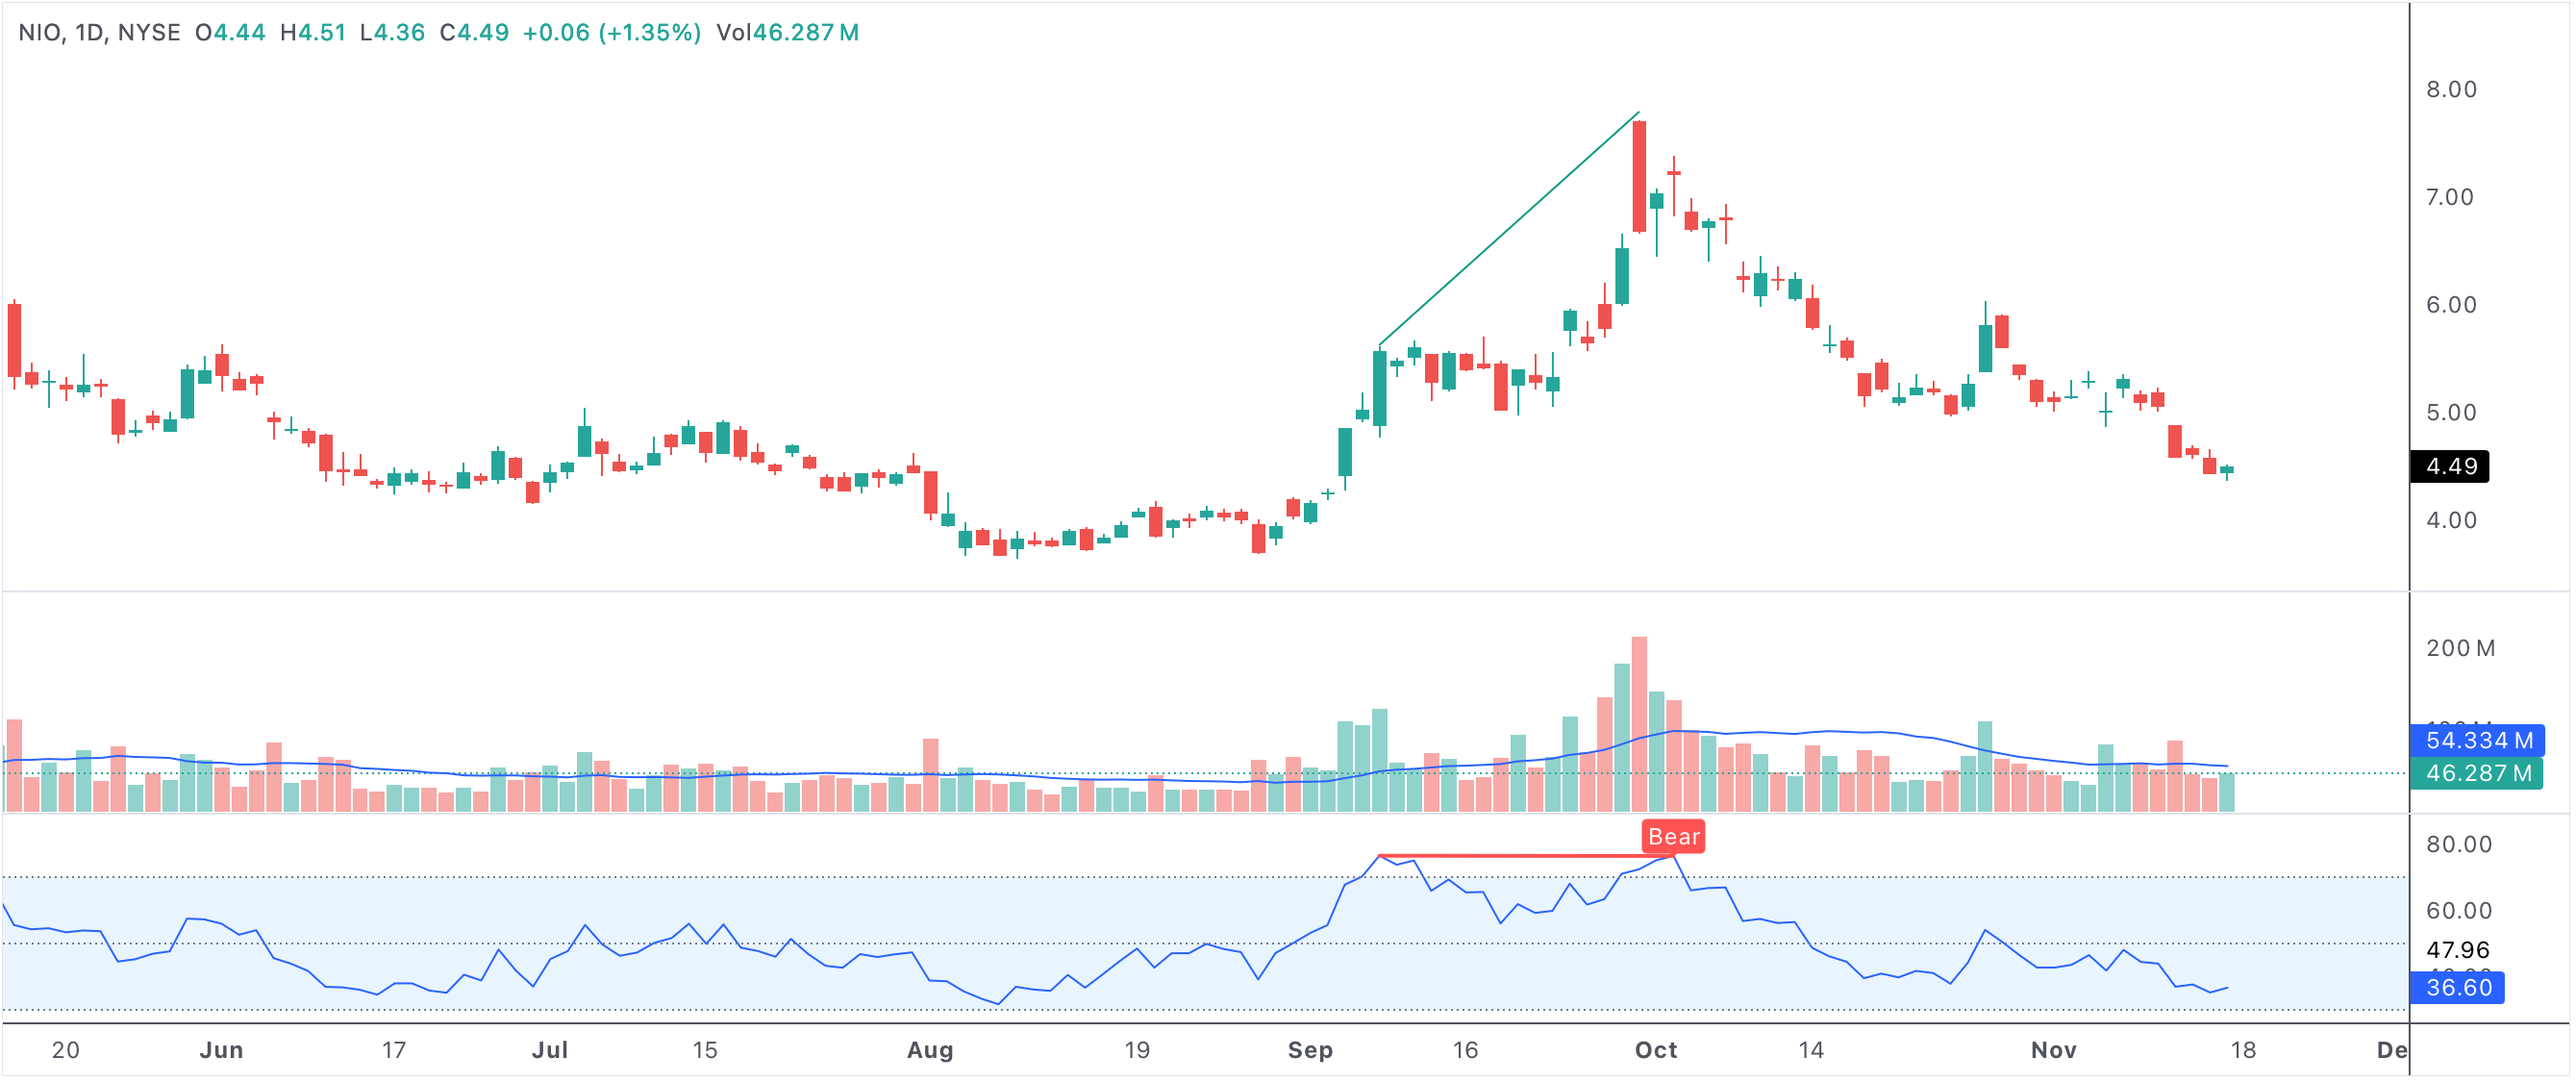
rsibearishdivergence

An example chart showing bearish divergence between price and RSI.

A bearish divergence occurs when the price goes higher while the RSI moves lower.

Understanding Bearish RSI Divergence

RSI divergence occurs when price action and indicator momentum move in opposite directions. A bearish divergence is present when stock prices register higher highs, but the RSI indicator prints lower highs. This mismatch means each new price high is supported by less and less buying strength. While the trend remains technically up, the divergence is a clear signal that the rally may be losing steam.

Traders and investors interpret bearish divergence with the RSI as a risk signal that buying pressure is waning and that the stock could soon face increased selling. Because the RSI is specifically designed to track momentum, its inability to follow price higher often points to potential trouble ahead for the bulls.

Why Is Bearish RSI Divergence Important?

Spotting a bearish divergence early allows market participants to anticipate possible trend reversals or corrections. When this signal appears, it frequently marks the exhaustion of an uptrend, warning traders that a sharp pullback or a period of consolidation may be near. Some key reasons to pay attention to this setup include:

  • Momentum loss: Weakening momentum despite rising prices signals reduced conviction among buyers.
  • Overbought conditions: The stock may already be overbought, and further gains are at risk.
  • Potential reversal: Divergence often precedes notable reversals, especially if confirmed by other indicators or patterns.
  • Heightened selling pressure: When traders spot divergence, it can trigger profit-taking and accelerate declines.

Typical Scenarios for Bearish RSI Divergence

Bearish divergence is most significant when it occurs at new highs following a sustained rally or near historical resistance. It’s also a powerful warning if it appears after a news-driven spike, a period of overextension, or during a broader market uptrend that starts to lose participation. For example, if a stock breaks to new highs on the chart but the RSI peaks lower than on its previous high, traders will begin watching closely for signs of reversal.

How Traders and Investors React

The presence of a bearish divergence with the RSI often leads to a change in trading behavior:

  • Technical traders may tighten stop-losses or take profits to protect gains.
  • Some may open short positions or hedge against potential downside risk.
  • Investors may reduce exposure, especially if other warning signals are present.
  • Momentum traders may wait for confirmation of a reversal—such as a breakdown below support—before acting.

Importantly, divergence is a signal of caution rather than an immediate sell order. Many wait for confirmation from price action, candlestick patterns, or a move below key support before taking decisive action.

Combining RSI Divergence With Other Signals

While bearish RSI divergence is a potent warning, its predictive power improves when used with other technical tools:

  • Volume analysis: Declining volume on higher highs further confirms a lack of conviction.
  • Moving averages: A break below a short-term moving average after divergence often accelerates selling.
  • Support and resistance: If divergence occurs near strong resistance, the risk of reversal increases.

Summary: Managing Risk With Bearish RSI Divergence

Bearish divergence between a stock’s price and the RSI is a proven technical signal that warns of fading momentum and rising risk. While not every divergence leads to an immediate reversal, it consistently alerts traders and investors to growing vulnerability within the uptrend. Used as part of a broader technical strategy, it helps market participants make smarter, risk-aware decisions and avoid getting caught in a sudden downturn.

View Stocks That Currently Meet This Condition: Stocks showing a bearish divergence with the RSI warn of trend reversal