RSI Bullish Divergence - Stocks Signaling Early Trend Reversals
A bullish divergence with the Relative Strength Index (RSI) is one of the most respected signals among technical analysts for spotting early signs of a potential market reversal. Bullish divergence occurs when a stock’s price forms new lows but the RSI indicator begins to climb, making higher lows. This pattern signals that while sellers may still be driving price lower, the intensity of downward momentum is fading—often an early sign that buyers are regaining control and a trend reversal may be imminent.
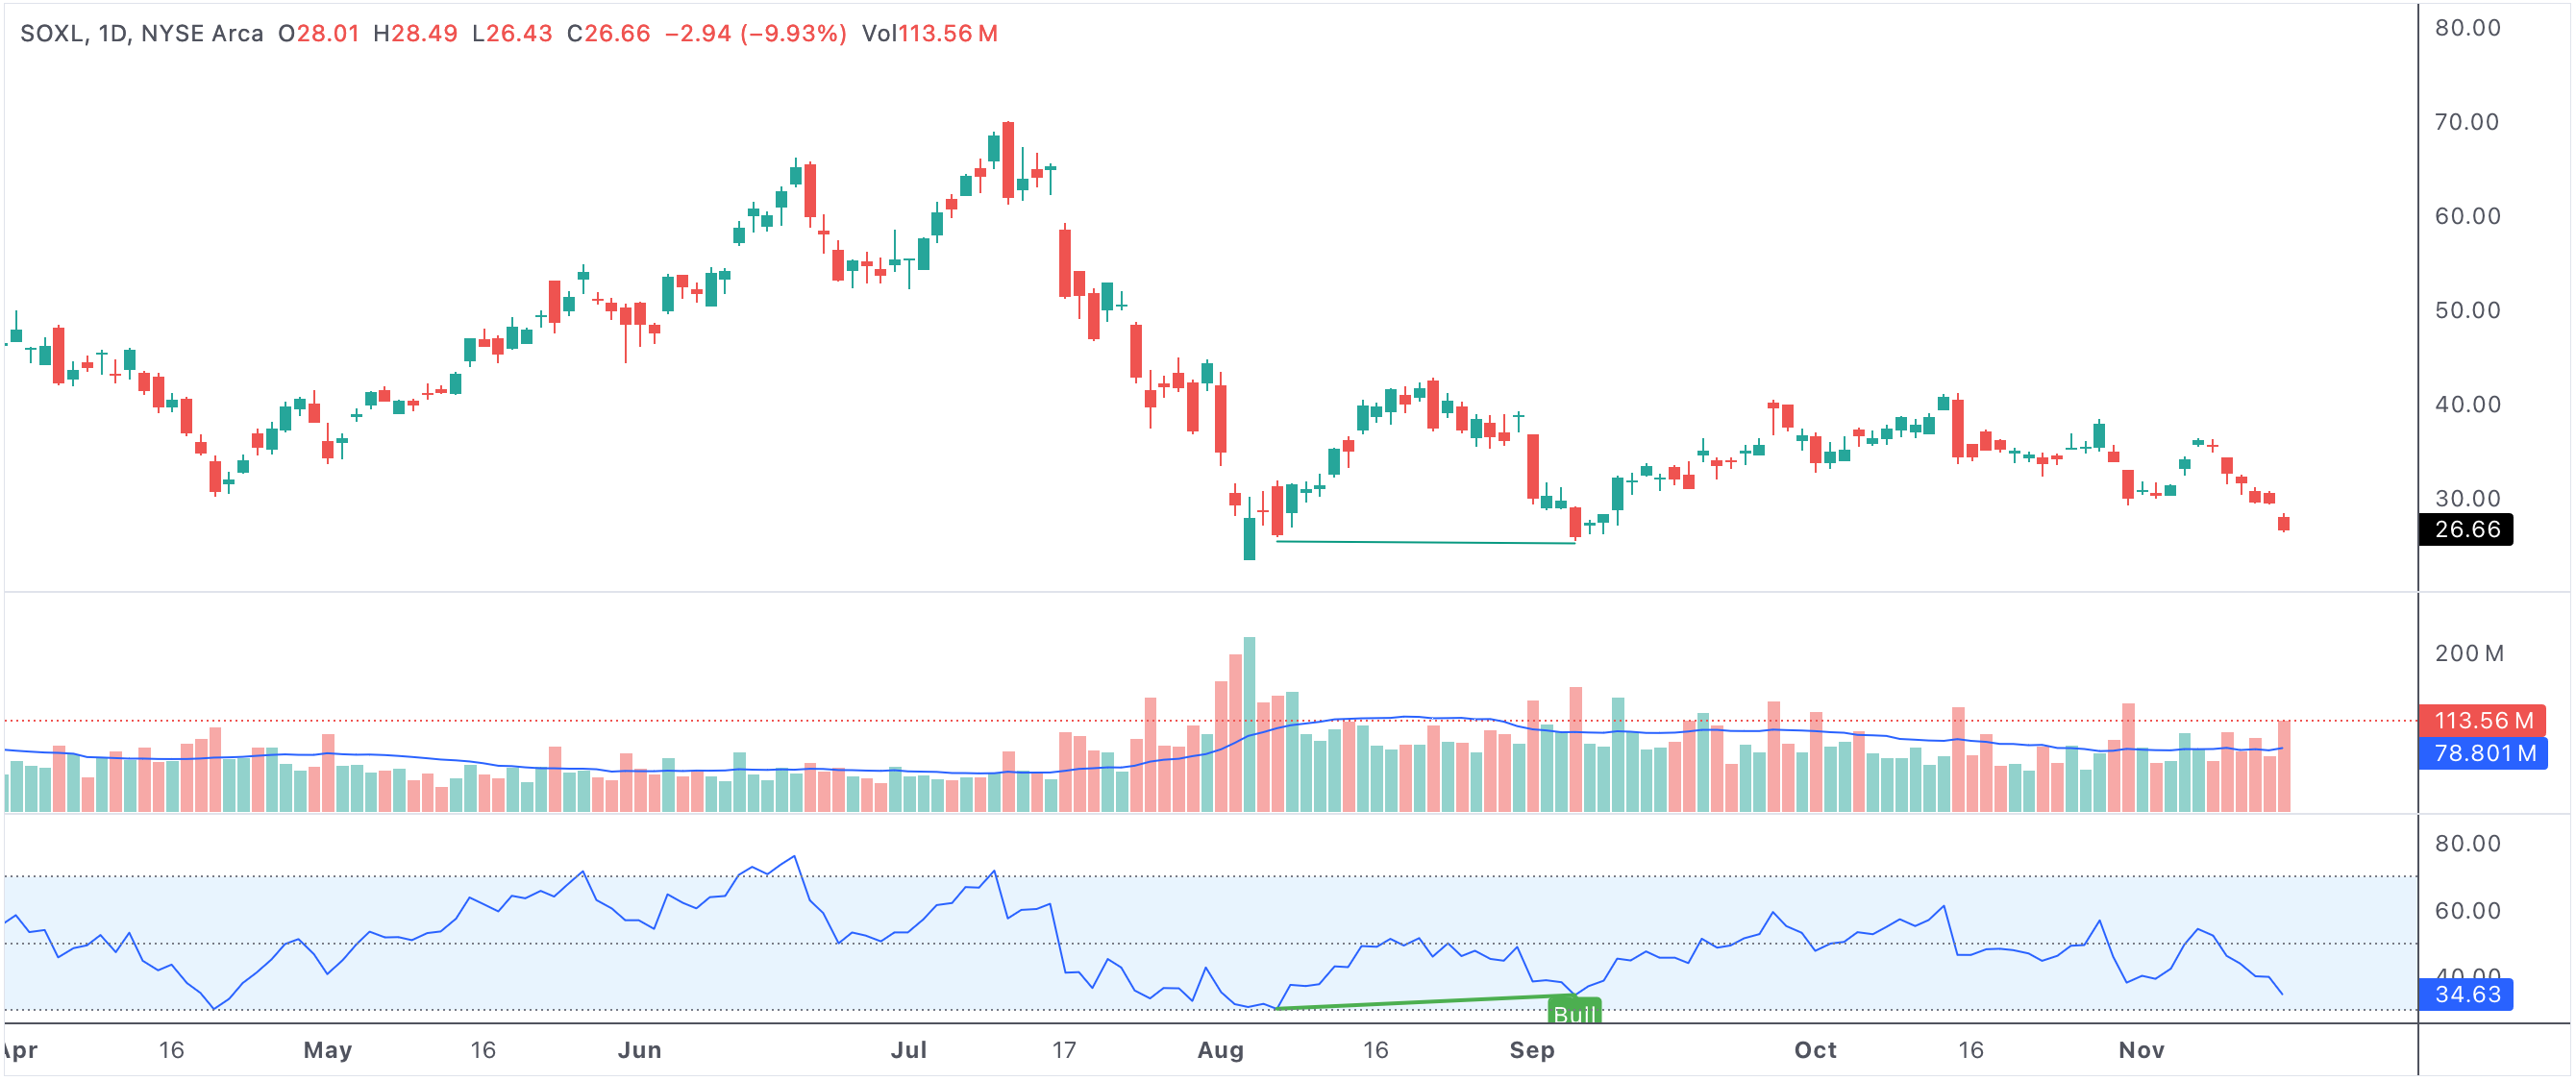
RSI Bullish Divergence
Notice how the price falls to new lows, but RSI prints a higher low, signaling waning selling pressure and a possible bullish reversal.
A classic bullish divergence: Price down, RSI up.
What is Bullish Divergence on RSI?
The RSI is a momentum oscillator that measures how quickly and intensely price moves over a given period, typically 14 days. On a standard scale of 0-100, values below 30 signal oversold conditions, while values above 70 indicate overbought levels. In a bullish divergence, the price chart forms lower lows, yet RSI rises or makes higher lows, suggesting that momentum is quietly shifting beneath the surface even as the crowd remains bearish.
This subtle discrepancy between price and momentum is important because it often precedes a change in direction. When the RSI diverges from price after a long downtrend or at key support zones, it tells technical traders that a possible trend reversal is forming. When confirmed by other technical factors—like a spike in volume, bullish candlestick patterns, or support holding—the signal becomes even more powerful.
Why Do Traders Watch For RSI Bullish Divergence?
Bullish RSI divergence is especially valuable in oversold markets or after steep corrections, as it helps pinpoint where panic selling may be ending and buyers are quietly stepping in. Divergence can act as an early alert for short-term bounces or even the beginning of a new bullish trend. This makes it a popular strategy for both swing traders and long-term investors who want to catch reversals early, potentially ahead of the broader market.
- Early Warning: Bullish divergence is often visible before the price begins to turn, giving traders a head start.
- Confirmation: When other indicators or chart patterns align, divergence becomes a high-confidence setup.
- Risk Management: Entries based on divergence can offer well-defined stop-loss points just below recent lows.
- Works Across Timeframes: Whether you trade daily charts or intraday moves, RSI divergence can signal key turning points.
How to Trade Bullish Divergence Effectively
Trading RSI bullish divergence starts with patience and confirmation. Look for the following steps:
- Wait for RSI to form higher lows as price makes lower lows.
- Seek confirmation from volume spikes, reversal candlestick patterns (such as hammers or bullish engulfing candles), or a break above short-term resistance.
- Set a stop-loss below the most recent swing low to manage risk in case the signal fails.
- Target prior resistance levels, moving averages, or the next significant high for partial or full profit-taking.
Traders often find their best results when divergence coincides with support zones or major moving averages, and especially when the overall market is showing signs of stabilization.
Real-World Examples and Practical Impact
Bullish RSI divergence has marked major bottoms in stocks, indices, and crypto markets. For instance, after a steep selloff, a stock might continue making fresh lows on waning volume while RSI quietly rises—a hint that institutional buyers are stepping in before the wider public notices. These moments can offer not just a bounce, but the start of a lasting uptrend as momentum shifts from bearish to bullish.
- Bullish divergence on RSI often signals the end of oversold, panicked conditions.
- Smart traders look for additional confirmation before entering a trade, but act decisively when the setup aligns.
- Divergence can serve as an objective, repeatable signal for building trading strategies across assets.
- Always combine RSI divergence with sound risk management and market context.
By understanding and using bullish divergence with RSI, you can spot market reversals earlier, manage risk more effectively, and seize buying opportunities that others may miss. Keep an eye on these patterns—they can offer an edge in any market environment.