Stocks With Highest Volume Accumulation Over The Last 25 Trading Days
Stocks experiencing the highest volume accumulation over the last 25 trading days are often at the center of attention for both institutional and retail investors. Volume accumulation, a crucial concept in technical analysis, refers to sustained periods where the buying volume outpaces selling volume, leading to increased interest and potential upward price momentum. Monitoring stocks with significant accumulation can offer valuable clues about future price direction, as strong volume trends frequently precede meaningful technical breakouts and bullish reversals.
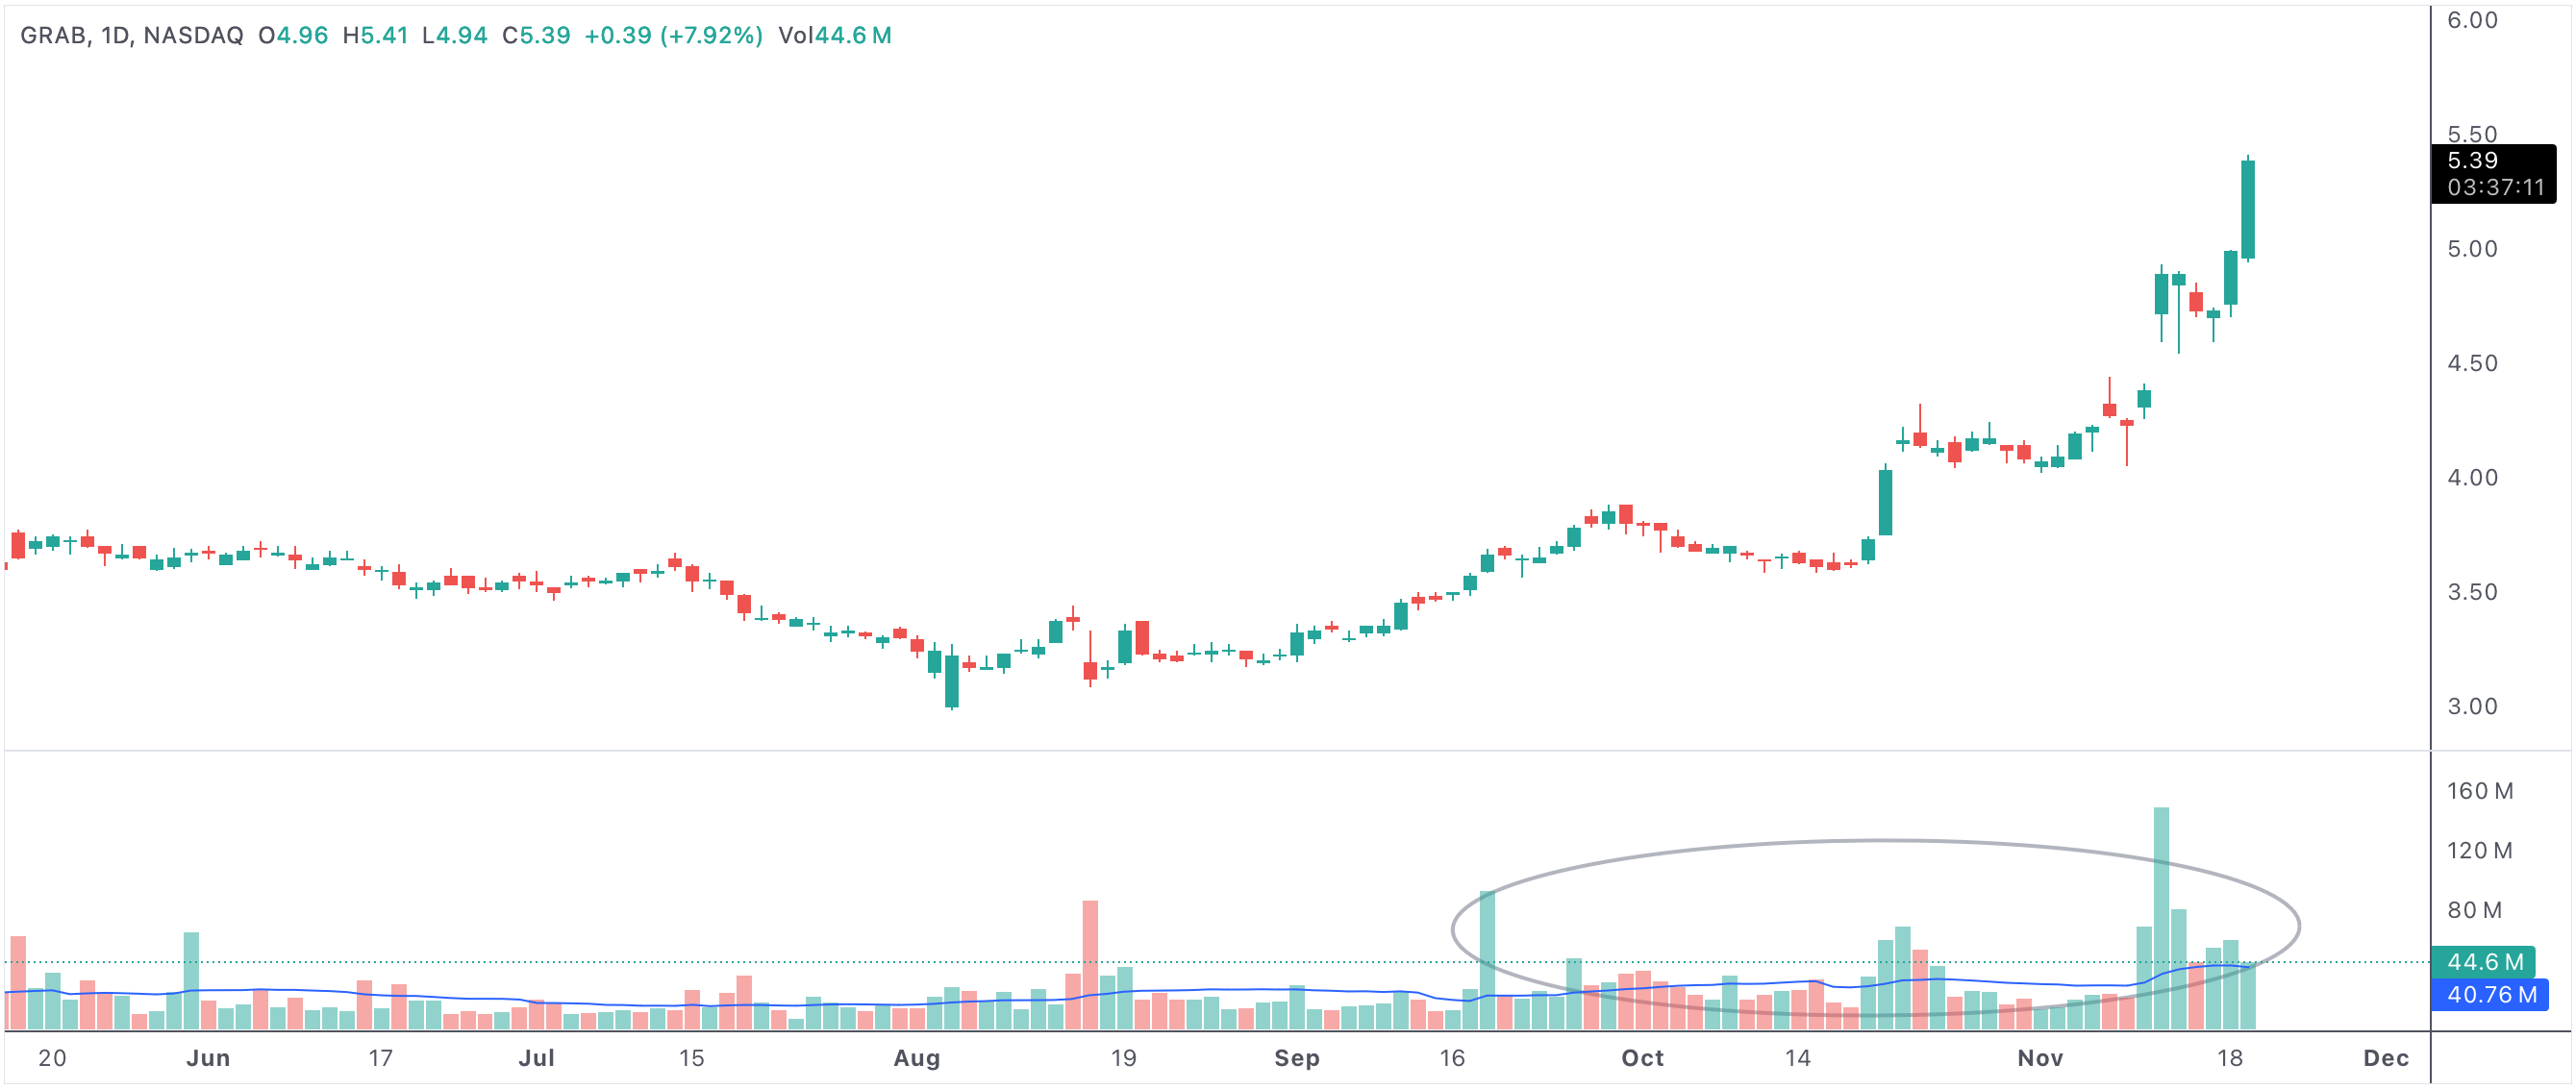
twentyfivedayvolumesurge
An example of a stock with the highest volume accumulation the last 25 days
Stocks with the highest volume accumulation in the last 25 days
Understanding Volume Accumulation
Volume accumulation is one of the earliest indicators of a shift in market sentiment. When investors and traders notice sustained volume spikes—particularly over a 25-day period—it suggests more market participants are buying than selling. This imbalance creates the groundwork for higher prices, especially when supported by positive news, earnings surprises, or improved sector fundamentals. Accumulation periods frequently coincide with the start of uptrends, making them a critical signal for momentum traders and technical analysts alike.
Why 25 Days Matter In Volume Analysis
The last 25 trading days typically represent about five weeks of market action, a substantial enough window to filter out random short-term fluctuations and identify real institutional activity. When a stock demonstrates heavy accumulation over this period, it often reflects growing interest from mutual funds, hedge funds, or other large players. These investors are capable of moving markets and can initiate major price trends simply through the magnitude of their trades. Observing accumulation patterns over this timeframe helps traders pinpoint which stocks might be primed for sustained moves.
Technical Breakouts and Price Momentum
High volume accumulation often acts as a precursor to technical breakouts. When a stock breaks above key resistance levels or chart patterns on above-average volume, it confirms the presence of aggressive buyers and signals the potential for further upside. This surge of demand attracts additional traders and momentum investors, creating a feedback loop that drives prices higher. Stocks that combine volume accumulation with bullish price patterns, such as cup-and-handle, double bottom, or ascending triangle formations, tend to outperform their peers.
- Volume accumulation often precedes technical breakouts and bullish rallies.
- Heavy trading volume may indicate institutional buying or positive earnings catalysts.
- Breakouts accompanied by high volume are more likely to succeed and sustain momentum.
- Monitoring 25-day volume patterns helps filter out short-term noise and focus on genuine trends.
Institutional Interest and Accumulation Patterns
Institutions tend to accumulate positions gradually to avoid excessively moving the price against themselves. By tracking accumulation over 25 days, traders can spot the footprints of these market participants before the broader market catches on. Heavy institutional accumulation is frequently a bullish sign, as these large entities usually conduct thorough fundamental analysis before initiating large positions. Their entry can lead to prolonged upward trends, supported by continued buying as more participants join in.
Market Sentiment and Catalysts
Volume accumulation doesn’t occur in a vacuum. It often coincides with positive company news, earnings reports, upgrades from analysts, or favorable sector developments. These events can serve as catalysts, sparking increased interest and trading activity. As more investors notice the rising volume, the stock can gain momentum, leading to outsized price moves. Traders should always consider both the technical setup and underlying news flow when evaluating accumulation patterns.
Using Volume Accumulation To Spot Opportunities
In summary, tracking stocks with the highest volume accumulation over the last 25 days is a powerful method for finding potential breakout candidates and bullish reversals. By focusing on sustained buying activity, investors can better identify stocks that have both technical and fundamental tailwinds. For those seeking outperformance in a dynamic market, volume accumulation remains one of the most reliable signals of underlying demand and the possibility of significant upward price movement.