First UT bot sell day after longest consecutive buy signals in uptrend
The appearance of a UT bot sell signal after the longest consecutive buy days is a highly notable event for technical traders and market observers. This signal, generated by the UT (Universal Trading) bot algorithm, emerges only after a prolonged series of bullish indications—days when the UT bot consistently flagged buy signals. Such a sequence typically reflects robust upward momentum and strong buyer participation in the stock or market. However, the abrupt switch to a sell signal, especially after a record-setting buying streak, may serve as an important warning of changing market dynamics.
firstutbotdownday
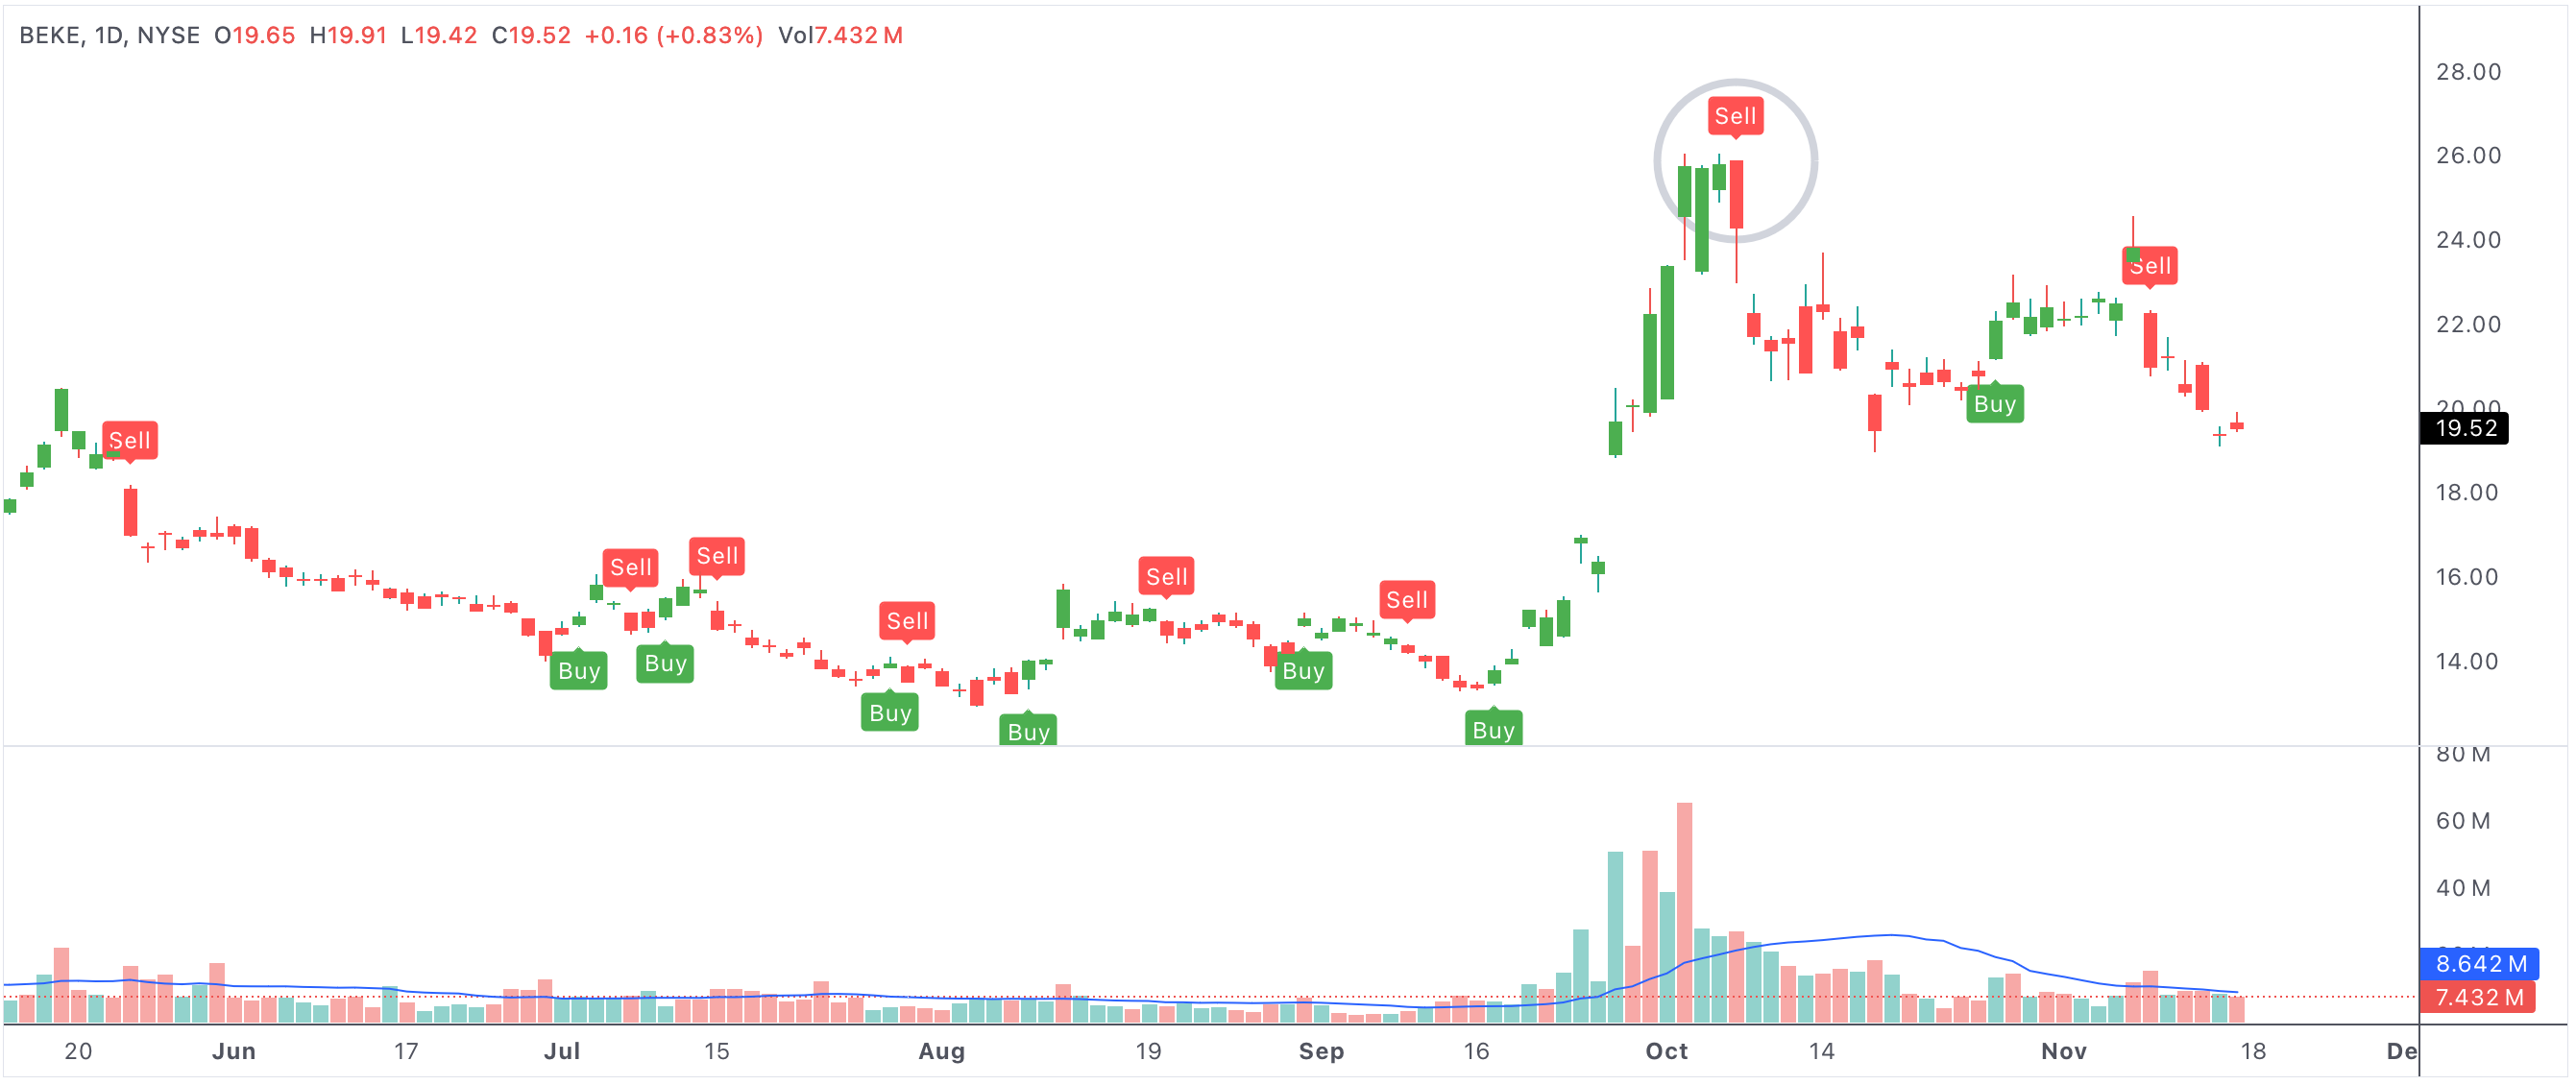
An example chart: First UT bot sell day after longest consecutive buy days
First UT bot sell day after longest consecutive buy days
Understanding the UT Bot Algorithm and Buy Streaks
The UT bot is a popular technical indicator that seeks to identify favorable buy and sell points based on price action and volatility. During a strong uptrend, the bot may generate a series of consecutive buy signals—sometimes spanning several days or even weeks—indicating that momentum is firmly on the side of buyers. The longer this streak persists, the more traders may grow accustomed to the bullish sentiment, often resulting in increased long positions and elevated confidence.
Significance of the First Sell Signal
When the UT bot finally flips from buy to sell, it suggests that the underlying trend could be shifting. This first sell day after the longest buy streak is often interpreted as a sign of momentum exhaustion. Buyers who have ridden the uptrend may become cautious, and some may begin to take profits or tighten stops. The initial sell signal may also attract short-term traders looking to capitalize on a possible pullback or trend reversal.
- First UT bot sell day after a long buy streak signals waning bullish momentum.
- Momentum exhaustion increases the probability of a short-term pullback.
- If supported by additional indicators or volume spikes, the reversal signal grows stronger.
- Many traders view this as a warning to reassess risk and manage positions proactively.
- The longer the preceding buy streak, the more meaningful the subsequent sell signal becomes.
Market Context: Bullish vs. Bearish Interpretations
It is important to interpret the first UT bot sell day within the broader context. If overall market sentiment remains bullish, the signal could simply mark a temporary pause or healthy consolidation within an ongoing uptrend. In such cases, aggressive buyers may view the pullback as an opportunity to add to positions. However, if the sell signal coincides with negative macroeconomic news or technical breakdowns (such as breaches of moving averages or support levels), it may foreshadow a more meaningful trend reversal and extended period of weakness.
Risk Management and Trading Strategy
Upon seeing the first UT bot sell signal after a lengthy buy streak, prudent traders often adopt a more defensive posture. This may include taking partial profits, moving stop-loss orders closer to the market, or hedging long positions. Some may initiate short trades, especially if other bearish indicators align. Regardless of the strategy, recognizing the significance of the signal helps traders protect gains and prepare for possible volatility.
Summary: Why This Signal Deserves Attention
The first UT bot sell day after the longest consecutive buy signals is a technical event that highlights potential changes in market momentum. While not all such signals lead to major reversals, they are reliable early warnings of buyer fatigue and increased risk of pullback or consolidation. Traders and investors should watch subsequent price action and combine the UT bot’s insights with other technical and fundamental data to make informed decisions in changing market conditions.