MACD Crosses Above Zero After Longest Period Below - Bullish Trend Signal
The MACD (Moving Average Convergence Divergence) is one of the most widely followed technical indicators in modern trading. When the MACD line crosses above zero—especially after enduring its longest stretch below the zero line—it’s a classic sign of shifting market momentum. This event is closely watched by traders and technical analysts for evidence of a possible transition from a prolonged downtrend to a new bullish phase.
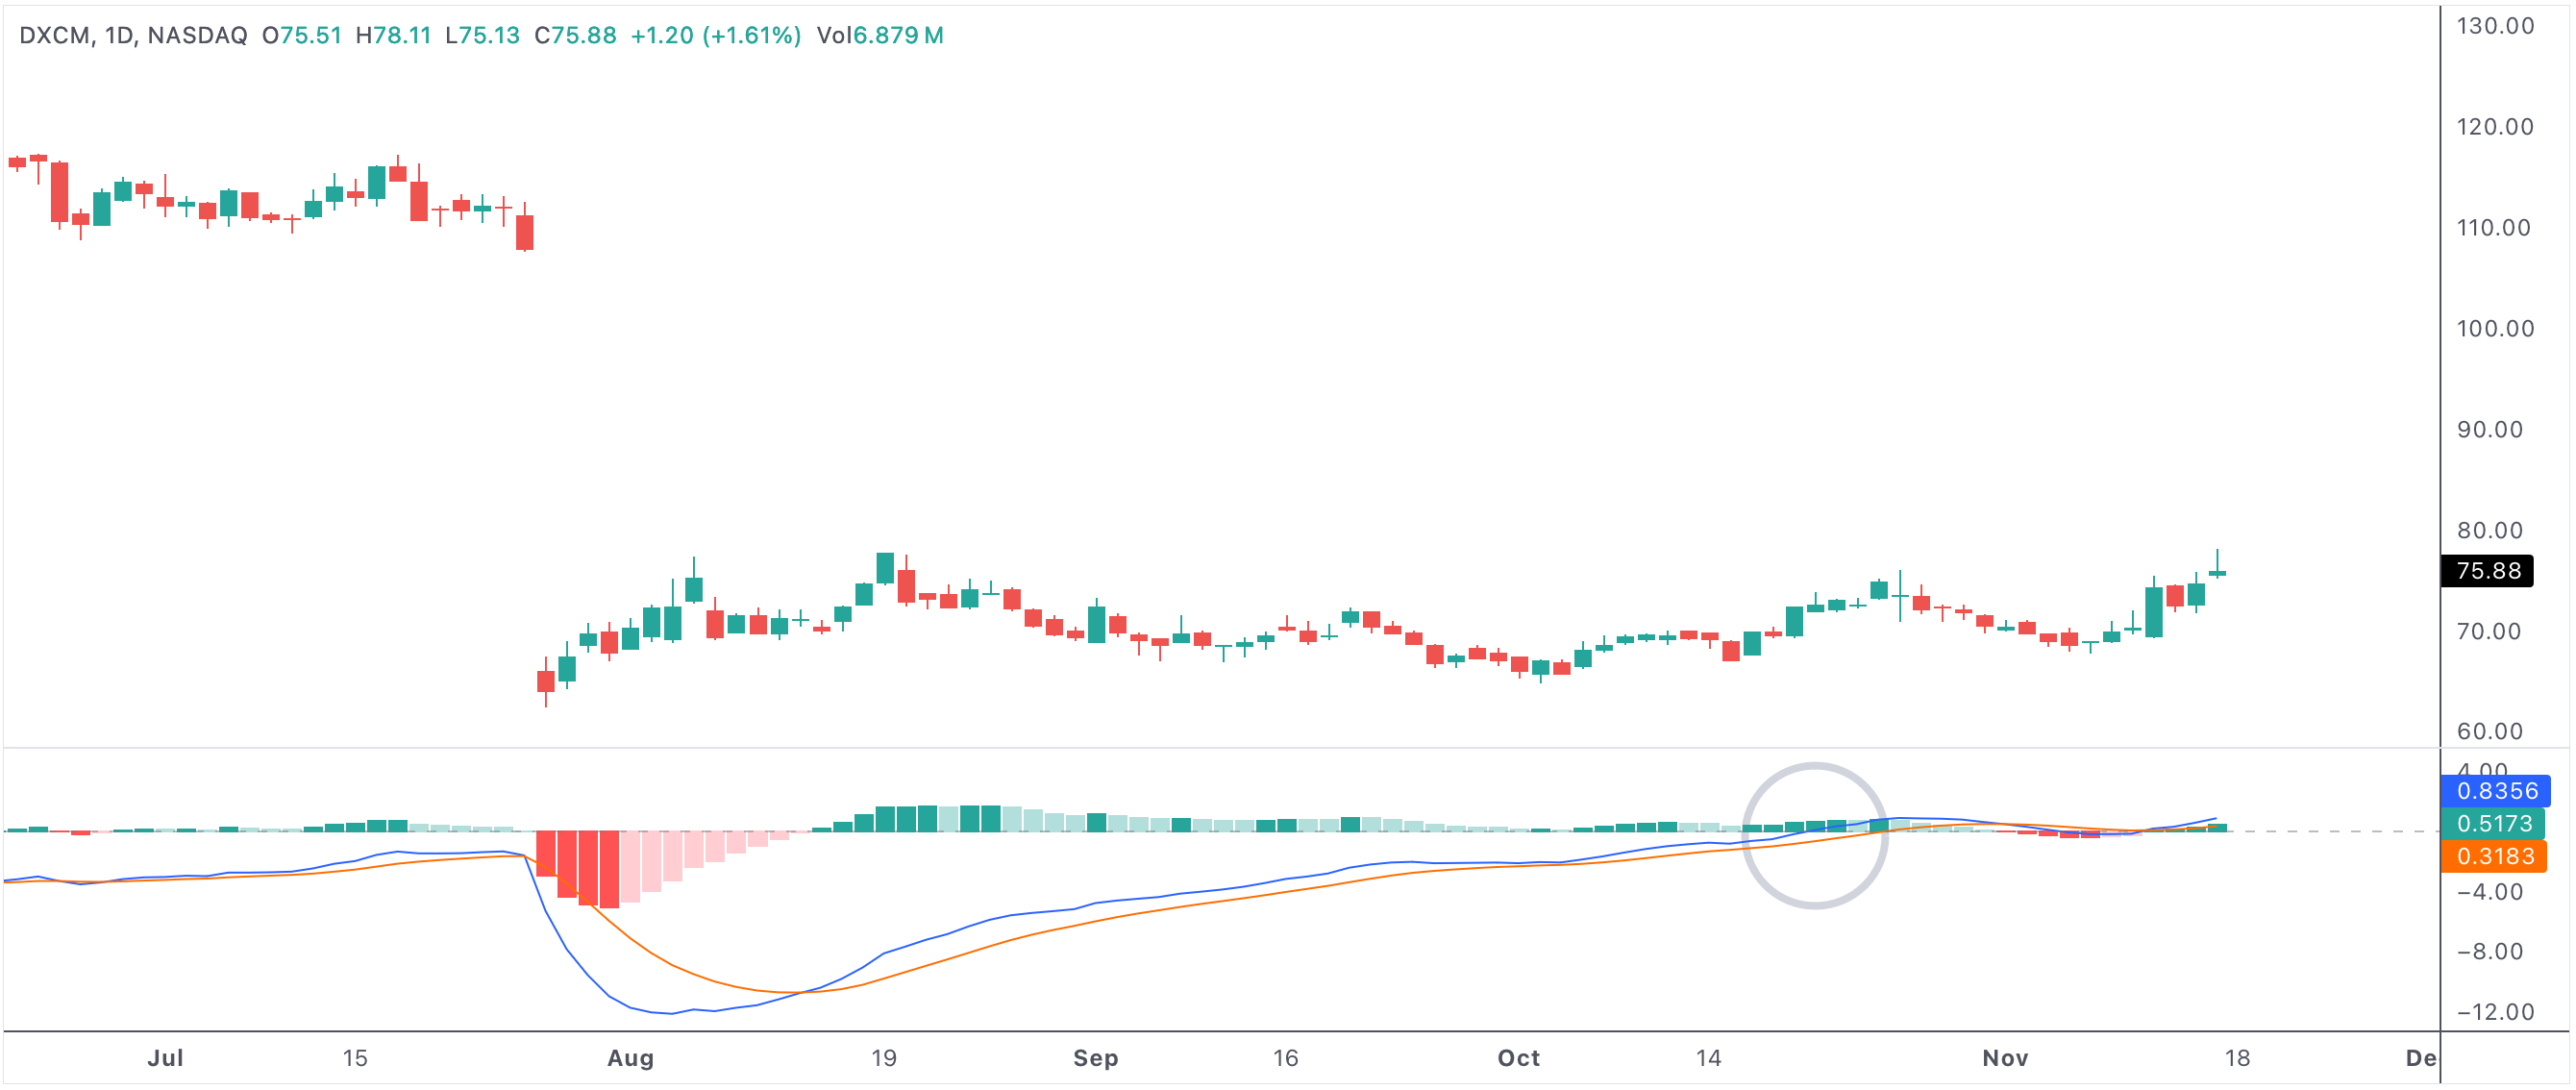
macdcrossabove0
A chart example showing the MACD crossing above zero after an extended period below, suggesting a shift in market sentiment.
MACD cross above 0 after longest consecutive days below
What Is the MACD Zero Line Crossover?
The MACD indicator is calculated by subtracting the 26-period EMA (Exponential Moving Average) from the 12-period EMA. This difference creates the MACD line, while a 9-period EMA of the MACD line forms the "signal" line. When the MACD line moves above the zero line, it indicates the short-term trend has gained strength over the long-term trend.
A zero line crossover—especially after the longest period of negative MACD values—suggests the end of an extended bearish phase. It’s a signal that the market may be reversing, as buyers start to overcome selling pressure and a new uptrend could be forming.
Why Does the Longest Period Below Zero Matter?
A short dip below the zero line may result in false signals, but when the MACD spends a long consecutive stretch below zero, it often means the underlying asset has been deeply oversold or locked in a sustained downtrend. When the MACD finally crosses above zero after such a stretch, it can act as a powerful confirmation that bearish momentum is exhausted. Traders look for this setup to spot the earliest stages of a trend reversal.
- Extended downtrends typically lead to stronger rebounds if a technical reversal emerges.
- Long negative MACD phases suggest selling is widespread, setting the stage for a "reset" in sentiment.
- The first positive MACD reading can spark fresh buying interest, especially from technical investors.
Bullish Implications of MACD Zero Crossovers
When the MACD line crosses above zero after the longest period below, several bullish factors come into play:
- Momentum Shift: It signals that momentum is turning in favor of buyers, not just a short-term bounce.
- Potential Trend Reversal: This move often marks the first technical confirmation of a trend change from bearish to bullish.
- Attracts Technical Investors: Many traders program automated strategies to react to MACD zero crossovers, fueling additional volume and volatility.
- Improving Sentiment: The market psychology shifts as investors grow more confident that the worst of the downtrend is over.
This scenario is especially meaningful when accompanied by other bullish signals—such as increased volume, relative strength, or support at key technical levels.
Trading the MACD Zero Line Crossover
For traders and investors, the ideal approach to trading this setup includes:
- Identifying stocks or ETFs where MACD has been negative for an unusually long period.
- Watching for a sustained cross and close above zero, not just a brief spike.
- Confirming the crossover with volume surges, bullish candlesticks, or additional momentum indicators like RSI or Stochastic.
- Setting stops just below recent lows, as false signals can occur during volatile markets.
- Scaling into positions as confirmation builds, targeting key resistance or moving averages for profit-taking.
Experienced traders may combine the MACD zero crossover with broader market trends to filter the highest probability trades. If the general market is also turning bullish, the odds of a successful reversal increase.
Why This Signal Stands Out
The MACD zero crossover after the longest consecutive days below is a high-conviction technical event. It highlights when momentum has fully reset and is finally swinging back in favor of bulls. Investors use it to pinpoint buying opportunities at the very beginning of a new trend, often before the wider market has caught on. This edge can help traders catch substantial moves, minimize risk, and optimize entries during major reversals.
- Objective and Quantifiable: The MACD crossover is clear and easy to track on any chart.
- Effective in All Markets: Works on stocks, ETFs, indexes, and even cryptocurrencies.
- Best with Volume: Look for confirmation with above-average volume or other technical indicators.
By mastering the MACD cross above zero after an extended downtrend, traders gain a powerful, time-tested tool for spotting new uptrends, boosting confidence, and making informed trading decisions.