Red Day Followed by a Bearish 2-Down Breakout That Closes Red
A red day followed by a bearish 2-down breakout that also closes red is one of the cleaner downside continuation patterns in The Strat framework. Price breaks below the prior candle's range and sellers remain in control into the close, which gives the pattern a more decisive bearish message than conflict candles do. Traders often compare it with a green day followed by a bullish 2-up breakout that closes green, since the two patterns represent opposite forms of clean directional continuation.
redredbear
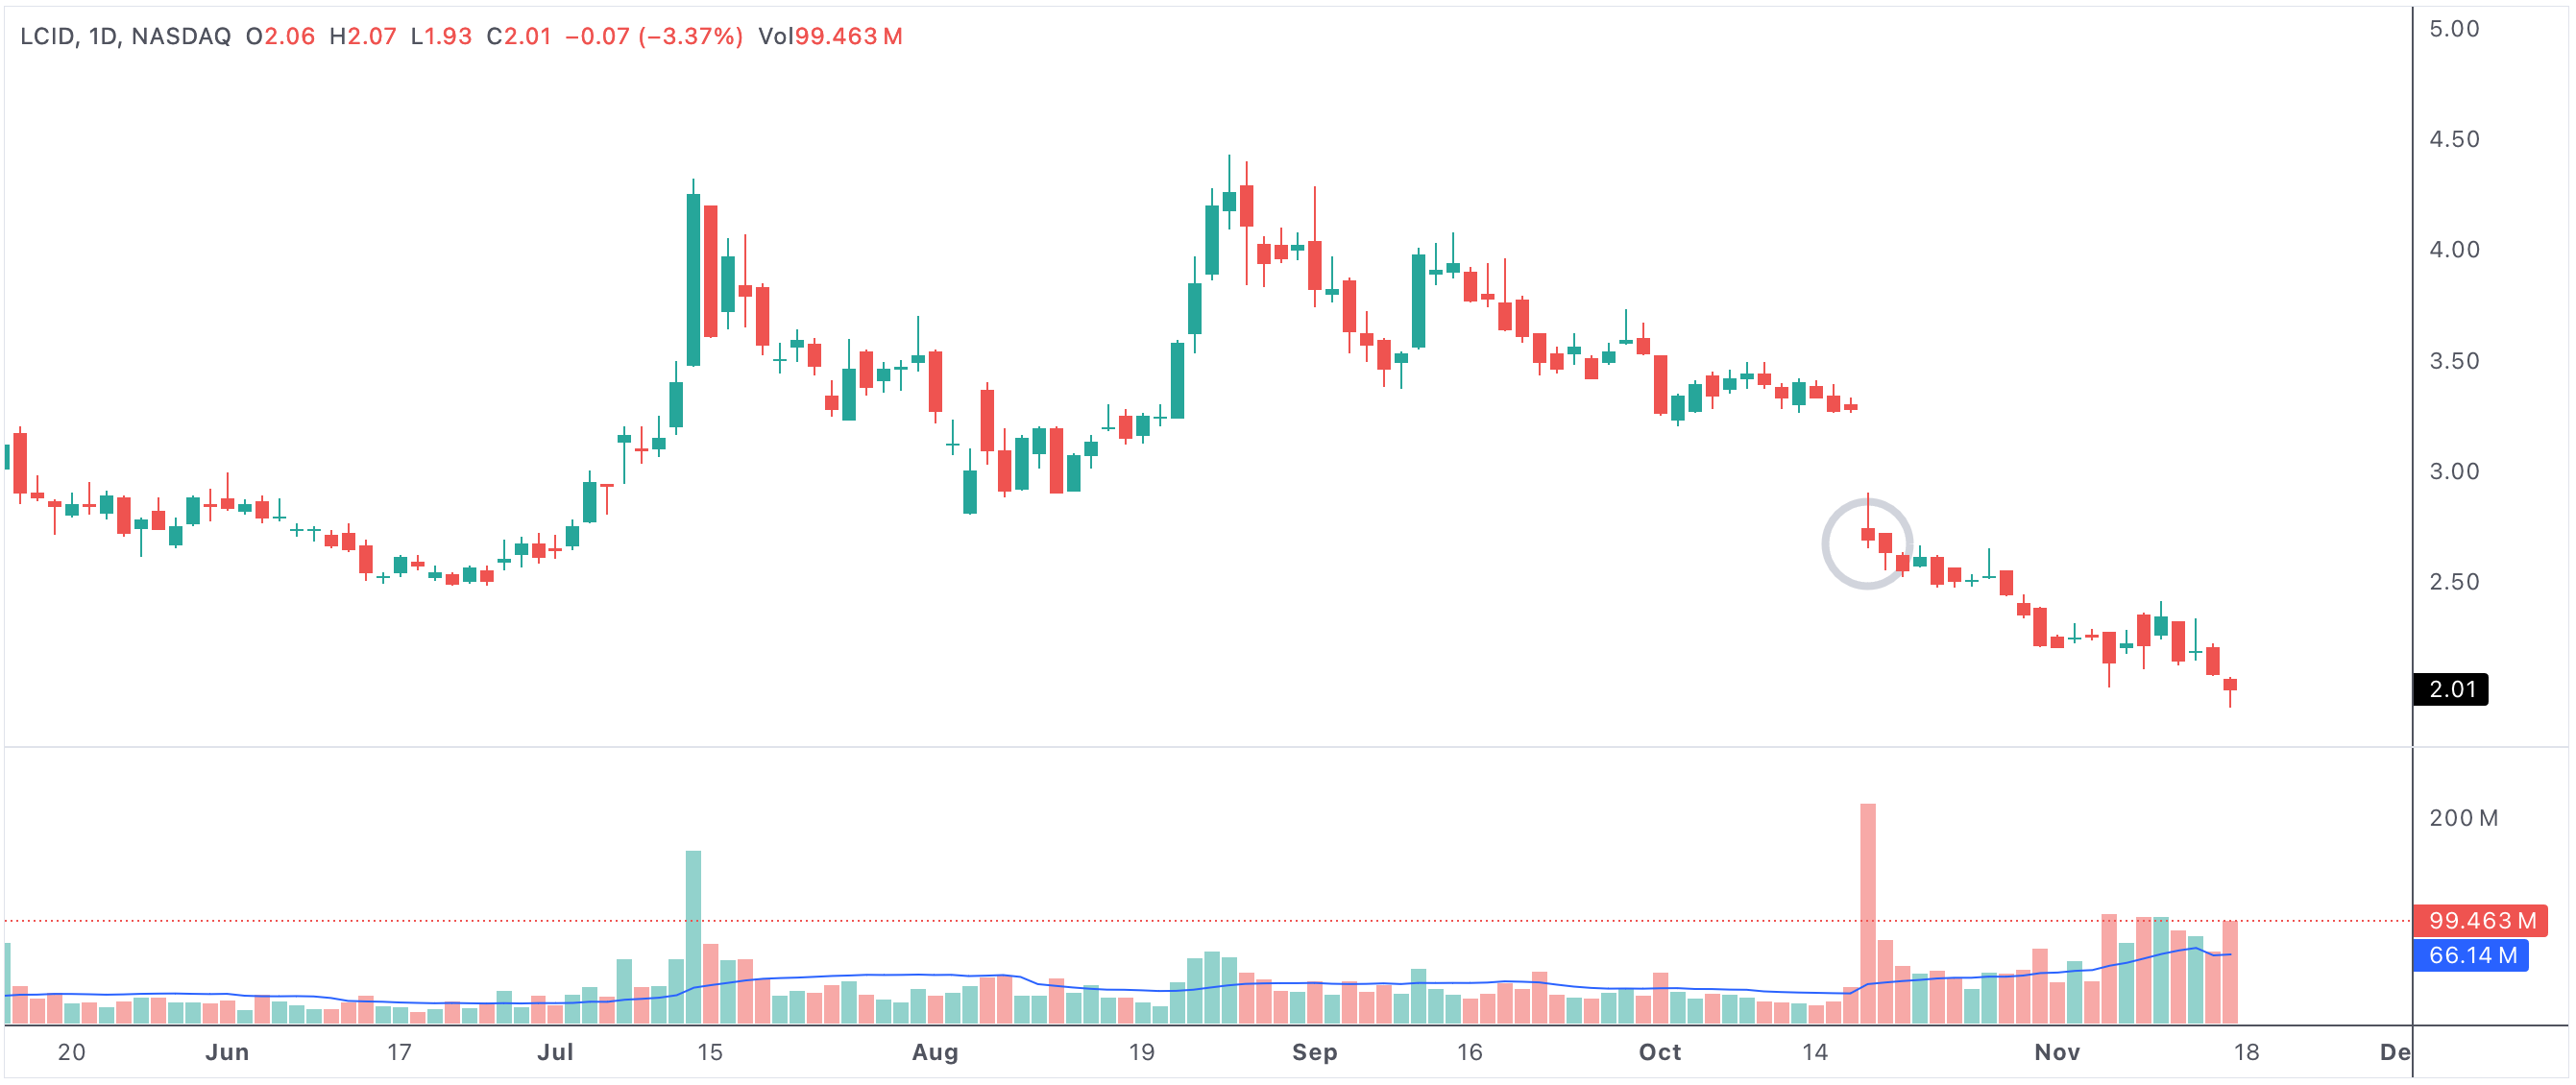
An example of a bearish 2-down breakout with decisive downside follow-through.
Red day followed by a bearish breakout 2-down with the bar itself red
Why This Pattern Matters
This setup stands out because the breakout direction and the close agree. Sellers pushed price lower and kept control through the session, which often reflects strong downside momentum or a failed bounce that is quickly being sold.
The signal is especially useful near resistance, after weak rallies, or when the broader market is already under pressure.
How Traders Use It
Some traders use this pattern to identify bearish continuation setups. Others watch it as a warning that recent weakness is not finished. The main value is recognizing when selling pressure is showing up in a clear and decisive candle structure.
- The bearish 2-down breakout signals downside expansion with conviction.
- A red close confirms sellers controlled the session.
- The pattern is cleaner than mixed bearish candles.
- This setup is useful for spotting breakdowns and failed bounces.