Stocks holding above 200-day SMA for longest streaks signal strong trend
The 200-day simple moving average (SMA) is one of the most widely followed technical indicators in stock market analysis. When stocks remain above their 200-day SMA for the longest consecutive days, it is a powerful signal of trend strength and sustained bullish momentum. This condition draws the attention of traders, investors, and institutions alike, as it reflects enduring confidence in the underlying company or market sector.
daysgt200sma
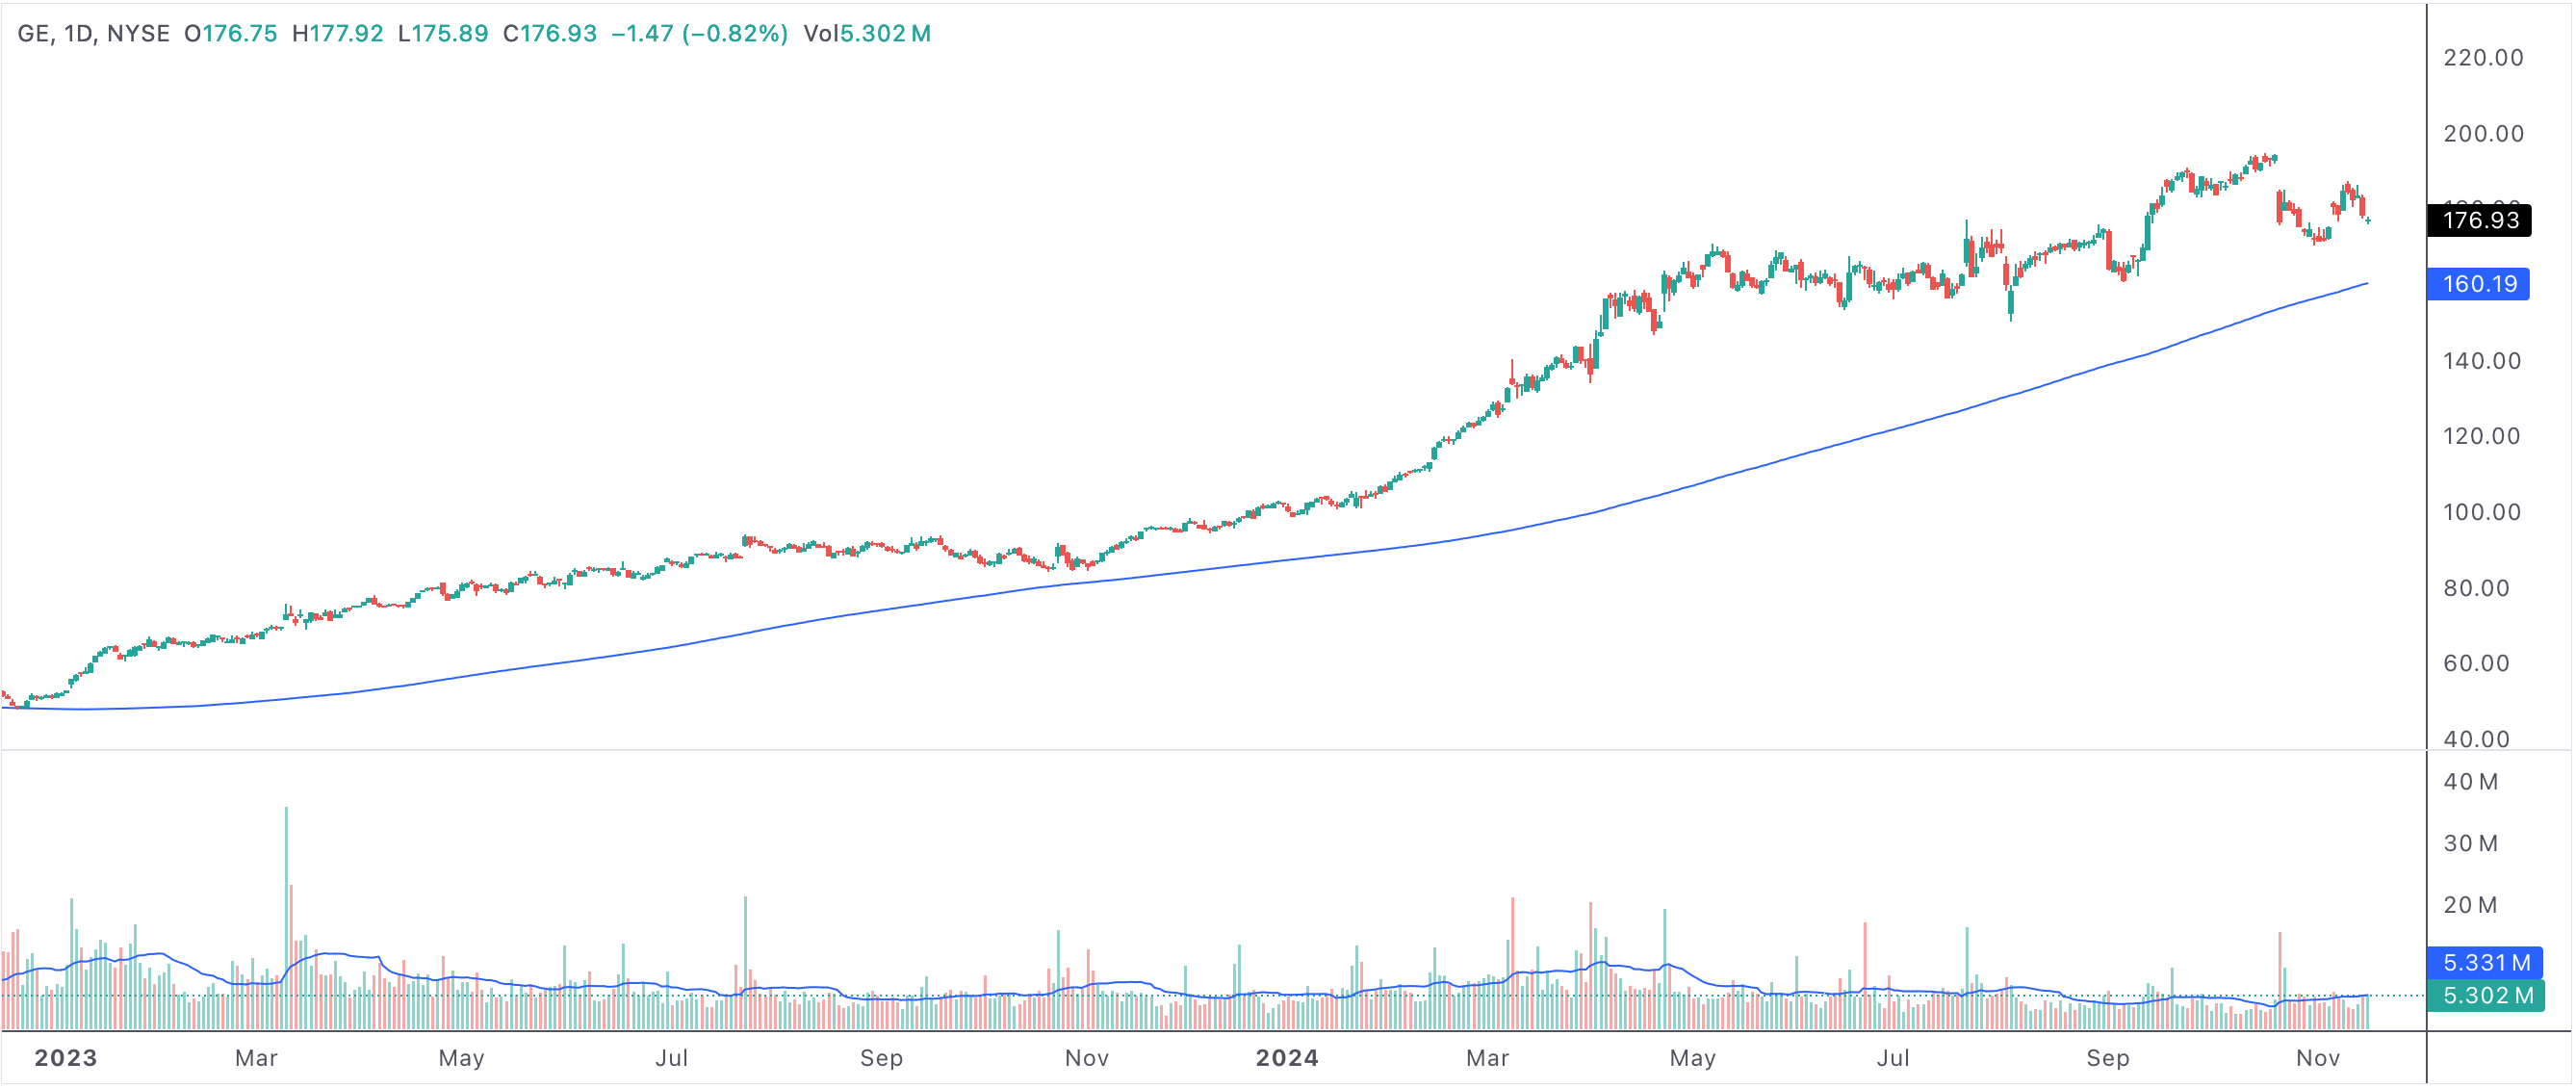
Example: a stock that has closed above its 200-day SMA for an extended streak
Stocks above 200 SMA for longest consecutive days
What Does It Mean When Stocks Stay Above the 200-Day SMA?
The 200-day SMA acts as a long-term trend filter. When a stock’s price holds above this level for many days or even weeks, it suggests that demand remains stronger than supply and that investors are willing to buy at increasingly higher prices. These long streaks above the 200-day average can signal that institutional buying is ongoing, reinforcing bullish sentiment.
Institutional traders and large funds often use the 200-day SMA as a key reference. A stock that consistently closes above this level may appear on their radar as a candidate for further accumulation, especially if accompanied by strong earnings, sector strength, or favorable macroeconomic trends.
Why Does a Long Streak Above the 200-Day SMA Matter?
Longevity above the 200-day SMA not only reflects market optimism but also demonstrates resilience through minor pullbacks and market volatility. This persistence is often viewed as a “stamp of approval” from the market, making these stocks attractive for trend-following strategies. Investors tracking these streaks look for companies with robust fundamentals, strong growth narratives, or leadership within their industries.
- Trend strength: Staying above the 200-day SMA for extended periods shows lasting bullish momentum.
- Investor confidence: Buyers are consistently stepping in to defend price levels above this key average.
- Market leadership: These stocks often outperform their peers, leading major indices or sectors.
- Psychological impact: Long streaks reinforce a positive feedback loop, encouraging more buyers to enter.
When Bullish Streaks Become Cautionary
While a long stretch above the 200-day SMA is typically positive, it can also lead to an overbought condition. After weeks or months above this average, some stocks may become extended relative to their longer-term value. This scenario often attracts profit-taking or cautious sentiment, especially if market conditions start to weaken or if the stock becomes overvalued on fundamental measures.
Technical analysts watch for signals that the streak is ending, such as a close below the 200-day SMA, increased selling volume, or bearish reversal patterns. A high number of stocks in the broader market falling below this line after lengthy bullish runs can be an early warning of a larger market correction.
Using 200-Day SMA Streaks in Trading Strategies
For trend followers, identifying stocks with the longest streaks above their 200-day SMA can offer compelling buy candidates, particularly on minor pullbacks toward the moving average. Some traders look for confirmation from other indicators—like relative strength, volume surges, or bullish crossovers with shorter-term averages—before entering a trade.
On the other hand, contrarian or mean-reversion traders may view extremely prolonged streaks as an opportunity to prepare for a pullback or trend reversal, especially if there is a loss of momentum or warning signs in overall market sentiment.
Real-World Examples and Practical Considerations
Major technology stocks or market-leading companies often exhibit the longest streaks above their 200-day SMA during bull markets. However, even these leaders can eventually revert or pause their runs, so ongoing analysis is crucial. Monitoring volume trends, earnings results, and broader economic signals helps investors gauge whether a streak is likely to continue or end.
Additionally, the 200-day SMA can act as a key support level. Many traders watch for “buy the dip” setups when prices approach this line from above, using it as a reference for risk management and stop-loss placement.
Conclusion: A Marker of Strength—But Not a Guarantee
Stocks above the 200-day SMA for the longest consecutive days offer valuable insight into market strength, trend persistence, and investor psychology. While this technical signal is a reliable marker of ongoing bullishness, it is important to monitor for signs of overextension and potential reversals. Combining streak analysis with other technical and fundamental tools can help traders and investors capture strong trends while managing risk in a changing market environment.