Stocks Above the 50-Day SMA for the Longest Time
Stocks that stay above their 50-day simple moving average (SMA) for the longest consecutive stretch often stand out as persistent trend leaders. A long streak above the 50-day SMA shows that buyers have consistently defended the intermediate-term trend and that pullbacks have remained shallow. Traders often compare this setup with the first down day after a long winning streak, since the breakdown signal becomes more meaningful after extended strength.
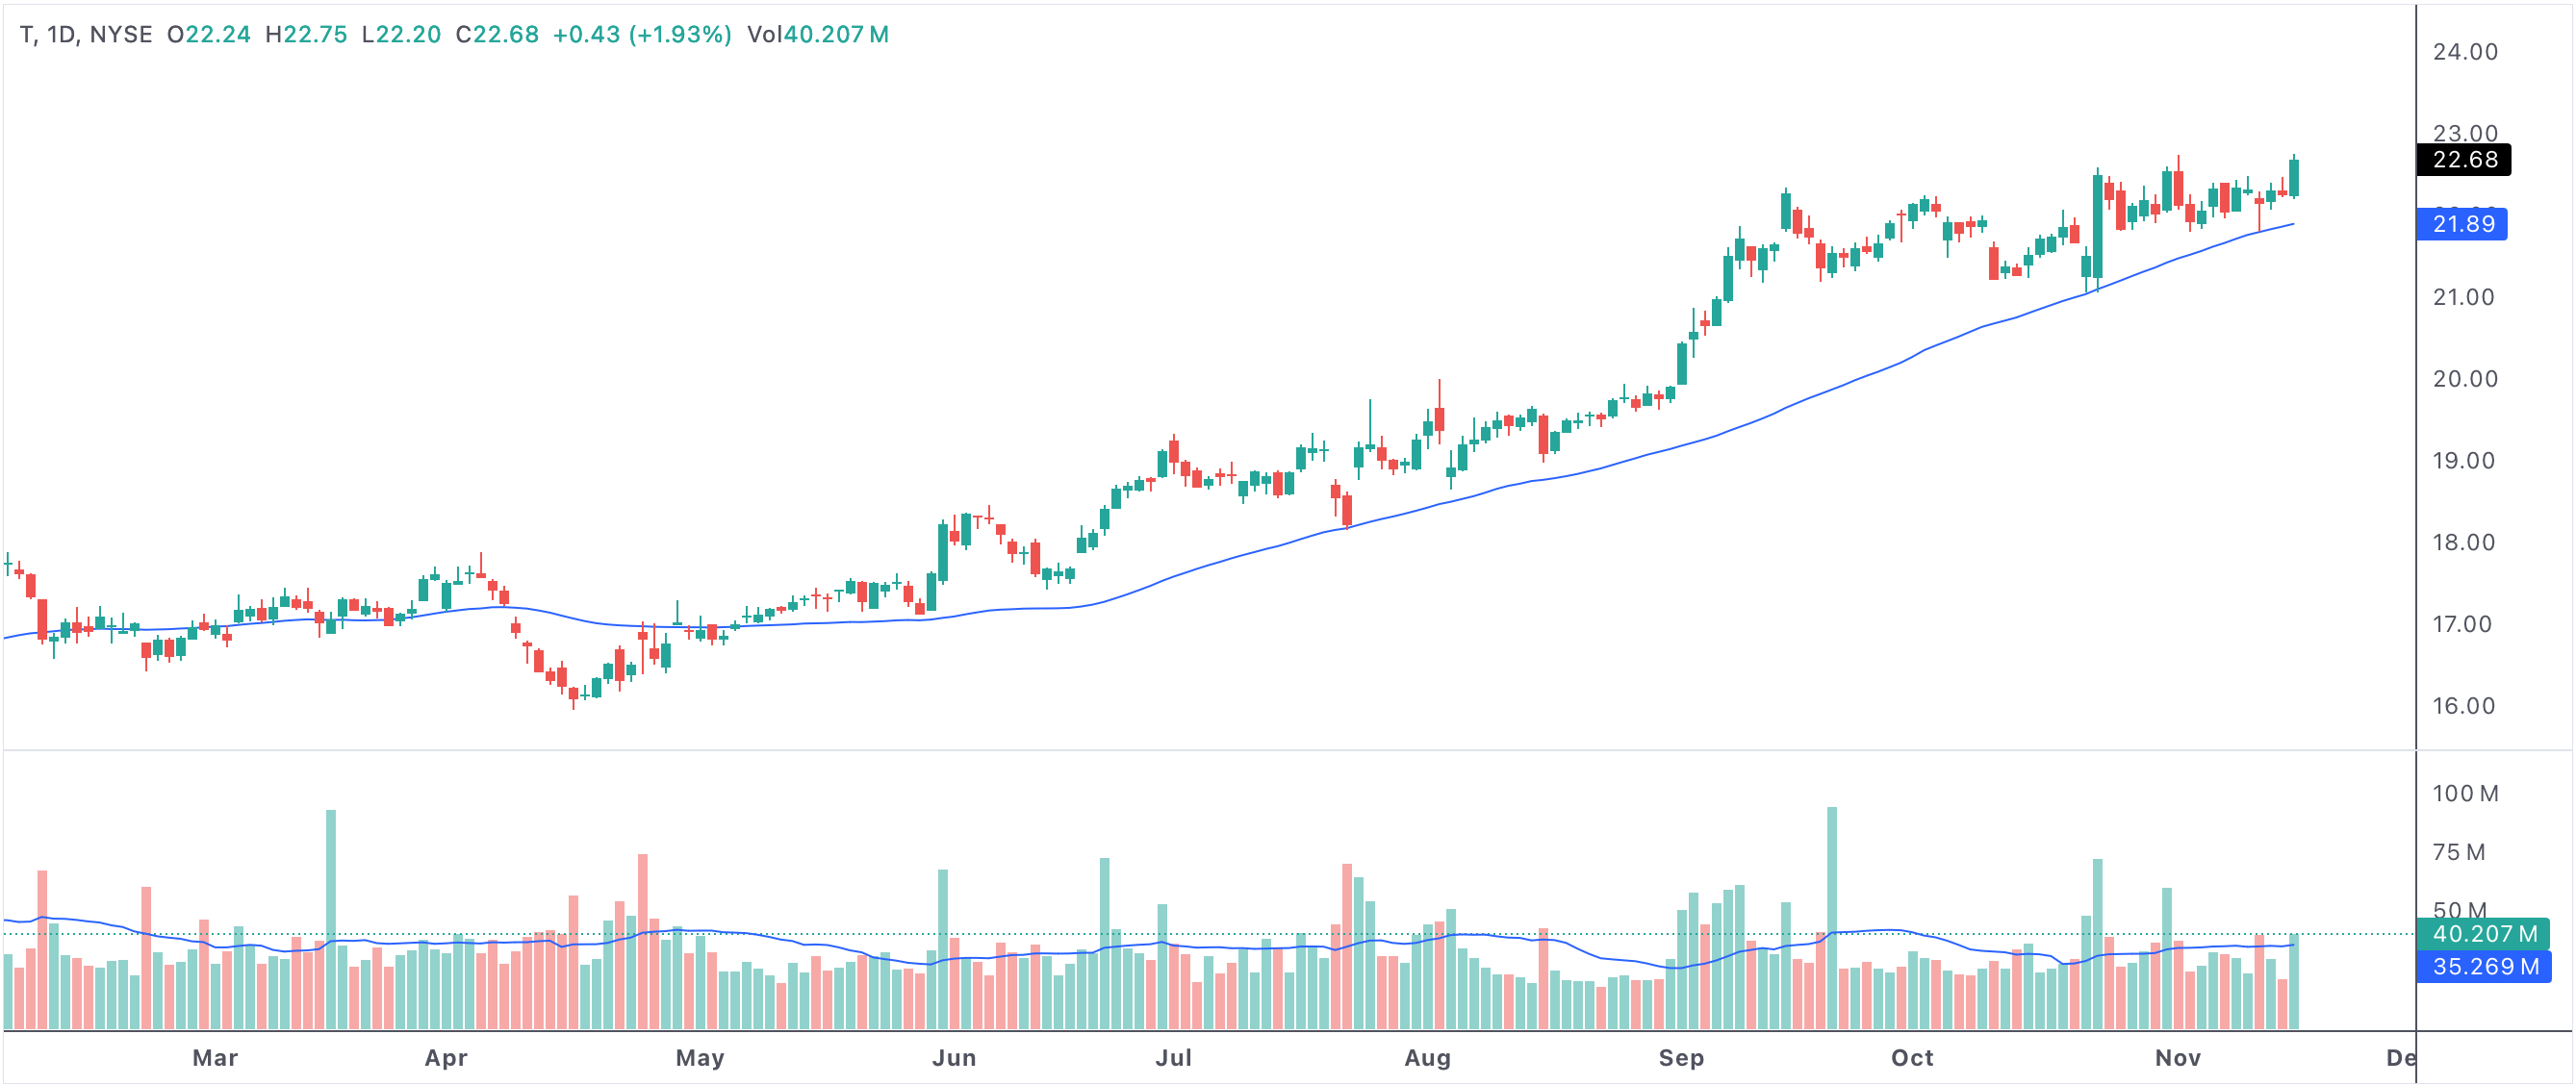
daysgt50sma
An example of a stock holding above its 50-day SMA for a long stretch.
Stocks above 50 SMA for longest consecutive days
Why This Matters
A long run above the 50-day SMA usually signals strong intermediate-term momentum and good trend health. It tells traders that the stock has not only moved higher, but has also avoided deeper pullbacks that would break the average. That makes this screen useful for identifying leadership names.
At the same time, long streaks can also warn that a stock is becoming extended and may eventually need a pause.
How Traders Use It
Some traders use this list to find strong trend stocks worth following. Others use it as a caution sign not to chase names that may already be stretched. The key is deciding whether the trend still looks orderly or whether momentum is starting to look tired.
- Long streaks above the 50-day SMA often reflect persistent intermediate-term strength.
- The screen can highlight leadership names with stable trend behavior.
- Extended streaks can also raise pullback risk.
- This setup works best when paired with support, resistance, and volume.