Stocks below 200 SMA for longest consecutive days - trends and signals
When stocks remain below their 200-day simple moving average (SMA) for the longest consecutive days, it often signals deep-seated trends in market sentiment. The 200 SMA is a key technical indicator used by investors and traders to gauge the long-term health of a stock or the overall market. Extended periods below this level can highlight persistent weakness, a sustained bearish trend, and possible opportunities for sharp reversals.

dayslt200sma
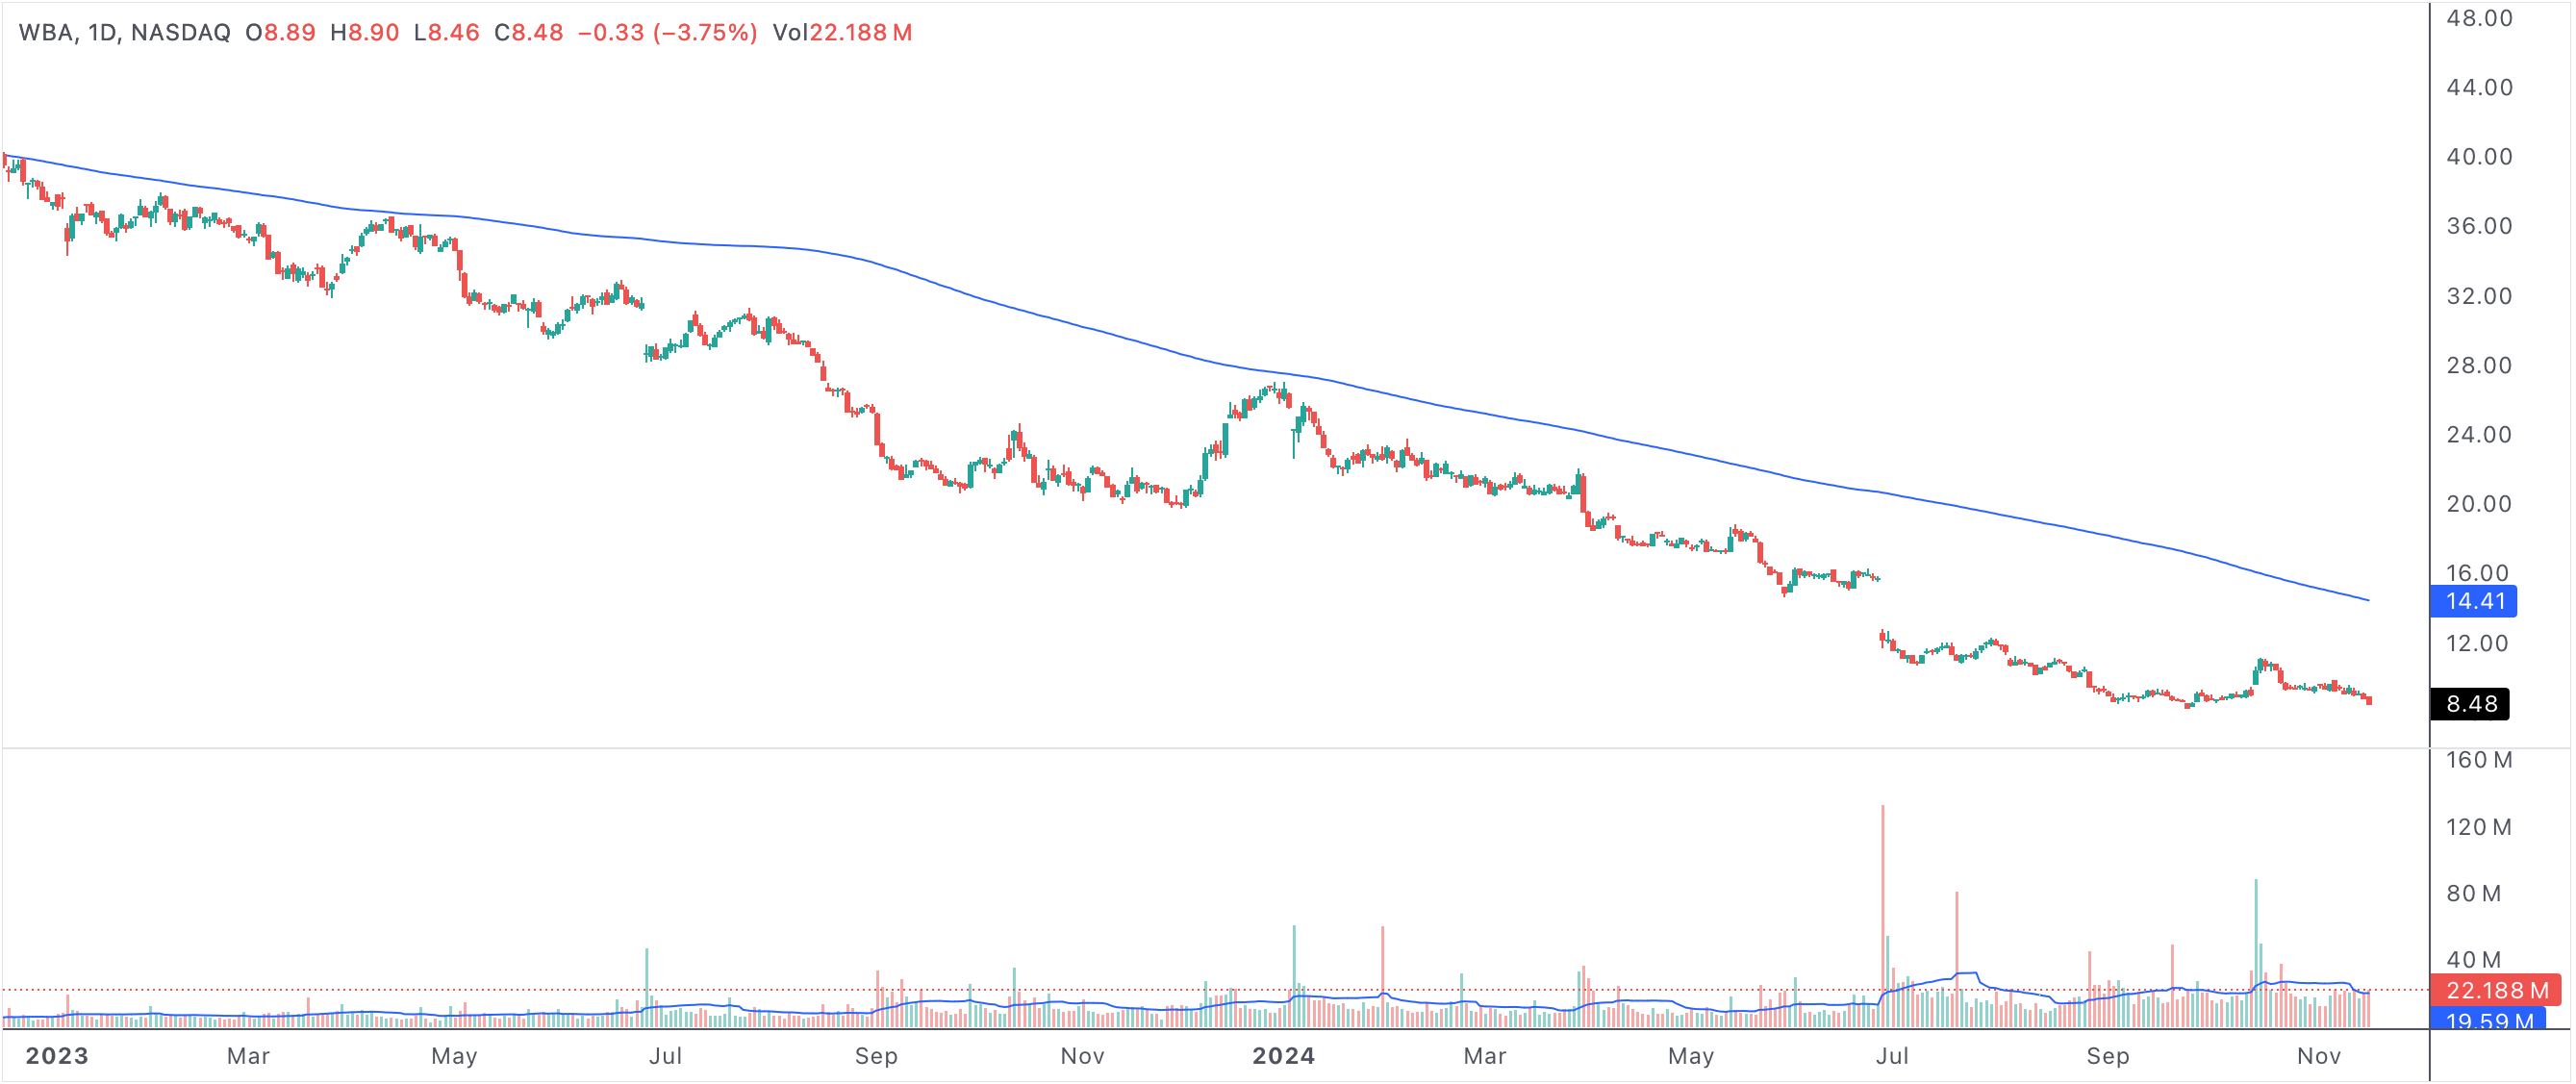
An example of a stock below 200 SMA for longest consecutive days
Stocks below 200 SMA for longest consecutive days
Why the 200-Day SMA Matters
The 200-day SMA is one of the most widely followed moving averages in stock analysis. It serves as a dividing line between long-term bullish and bearish market conditions. Stocks consistently trading below this level are considered to be in a sustained downtrend, with many institutional investors regarding this as a warning sign to avoid or reduce positions. Extended time spent below the 200 SMA often correlates with waning investor confidence and ongoing negative sentiment.
Interpreting Extended Periods Below the 200 SMA
Long consecutive closes under the 200 SMA can be viewed as a sign of persistent selling pressure. This price action usually suggests that buyers are unwilling to step in at current levels, and sellers remain in control. The longer the duration, the more entrenched the bearish trend appears. However, for some, these prolonged declines can create opportunities: oversold stocks may become attractive if there are signs of stabilization or changing market conditions.
Bearish Trends vs. Recovery Signals
While a lengthy stay below the 200-day SMA indicates weakness, it can also precede periods of significant recovery. Historically, some of the strongest rallies begin after stocks spend an unusually long time below this moving average. The shift from bearish to bullish sentiment is often triggered by improvements in fundamentals, sector rotation, or broader market catalysts. As price action consolidates, watch for increased volume, narrowing trading ranges, or bullish chart patterns as early recovery signals.
- Extended time below the 200 SMA signals a sustained bearish trend and possible investor capitulation.
- Stocks can become deeply oversold, offering value opportunities if sentiment begins to shift.
- Institutional investors often monitor this level for timing large entries or exits.
- A decisive move above the 200 SMA after a long decline can mark the start of a new uptrend.
- Technical confirmation is strengthened by increasing volume and positive momentum indicators.
Strategic Approaches for Traders and Investors
Traders may use the 200 SMA to set stop-loss levels or to time entries after false breakouts and recoveries. Long-term investors might accumulate shares gradually as a stock consolidates below the 200 SMA, waiting for a clear reversal before committing larger capital. It’s important to use additional technical and fundamental signals to avoid false starts, as not every extended period below the 200 SMA results in a bullish reversal.
Risks and Considerations
Prolonged weakness below the 200-day SMA can also be associated with structural business issues, sector-wide headwinds, or deteriorating market environments. As such, due diligence is critical before acting on a potential recovery signal. Confirm trend changes with multiple indicators—such as relative strength, volume, and broader market trends—to reduce the risk of entering too early.
Conclusion: Using the 200 SMA as a Guide
In summary, stocks below the 200 SMA for the longest consecutive days represent both risk and opportunity. This condition often marks the later stages of a bearish trend, but can also set the stage for powerful reversals when sentiment and fundamentals align. By combining technical signals with disciplined strategy, investors and traders can navigate these periods to identify compelling setups and manage risk effectively.