Stocks below 50 SMA for longest consecutive days - signals, risks, and setups
When stocks remain under their 50-day simple moving average (SMA) for the longest consecutive days, it offers crucial insight into short-term price momentum and overall market sentiment. The 50 SMA serves as a widely recognized indicator for traders and investors who seek to identify prevailing trends and turning points within a stock’s price action. A prolonged period below this level can indicate an ongoing bearish phase but may also present early signals for an eventual reversal.
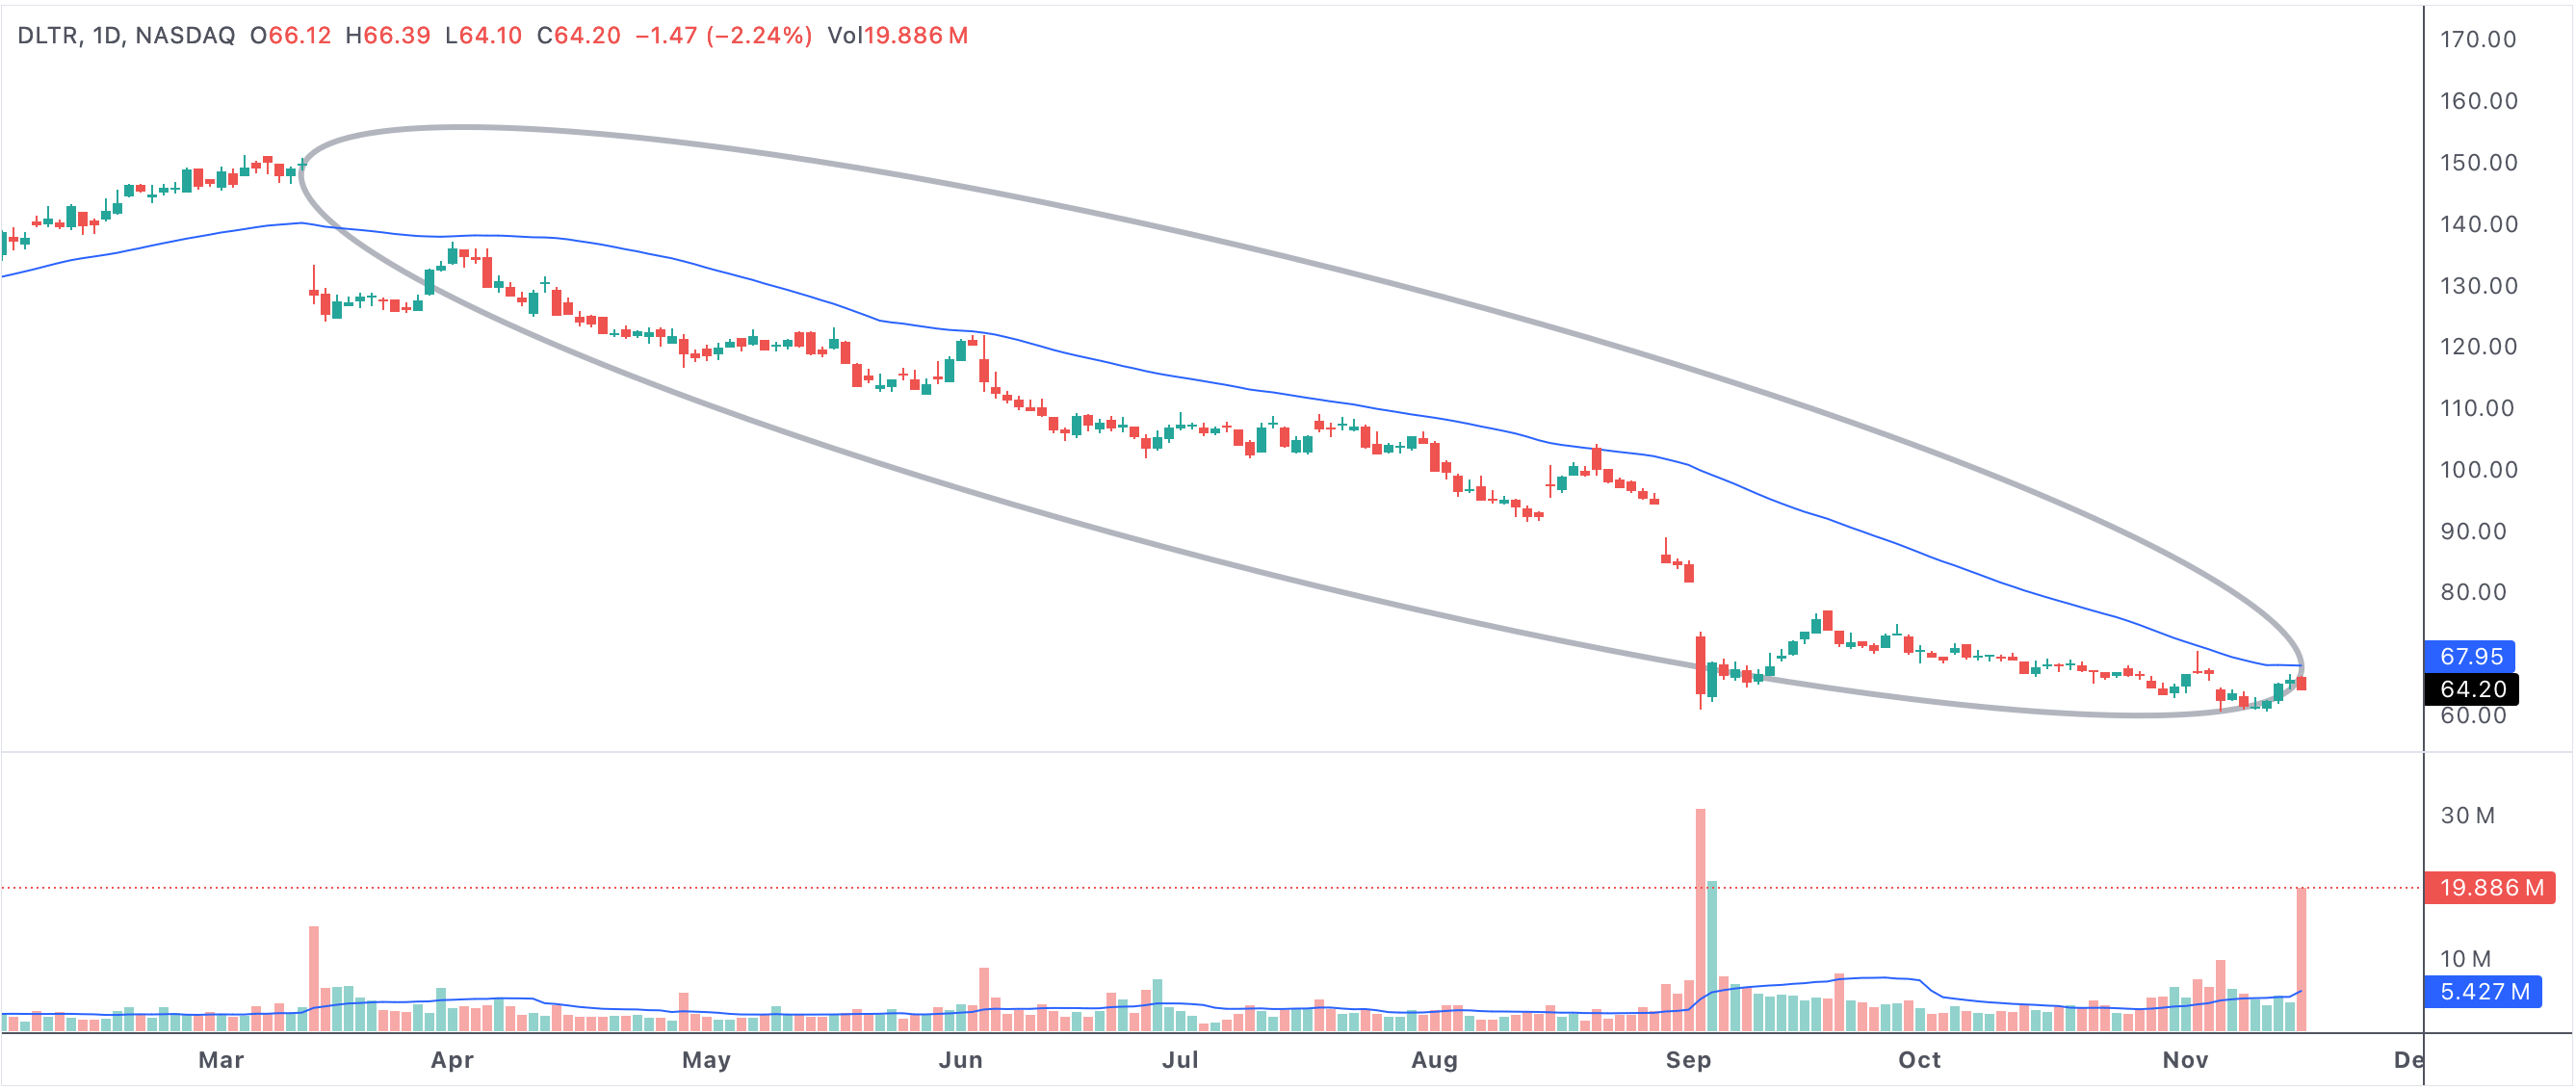
dayslt50sma
An example of a stock below 50 SMA for longest consecutive days
Stocks below 50 SMA for longest consecutive days
What the 50-Day SMA Reveals
The 50-day SMA is a key technical level used by traders to measure the health of a stock’s short- to medium-term trend. When price trades below this moving average for an extended time, it generally signals a phase of weakness. Investors may view this as a period where sellers are in control, and confidence in near-term upside is lacking. Stocks in this position often underperform broader markets or sector benchmarks, making the signal useful for identifying at-risk holdings or targeting potential short setups.
Bearish Implications and Market Psychology
Prolonged trading below the 50 SMA typically coincides with negative market sentiment. This can be driven by factors such as poor earnings, macroeconomic uncertainty, or sector-specific headwinds. The longer a stock remains below this line, the more entrenched the bearish trend becomes in the minds of market participants. Weakness below the 50 SMA is sometimes confirmed by declining volume, lower highs, and the absence of buying interest, which all reinforce a cautious or defensive approach among investors.
Identifying Potential Reversal and Buying Setups
Extended periods below the 50-day SMA do not last forever. Eventually, deeply oversold conditions and value opportunities attract contrarian investors and institutional buyers. Technical traders look for subtle signs of stabilization, such as sideways price action, bullish divergence on momentum indicators, or an uptick in volume. When a stock finally manages to close above its 50 SMA after a long drought, this breakout often acts as a trigger for renewed interest, marking the possible start of a new short-term uptrend.
- Long stretches below the 50 SMA indicate persistent bearish trends and may warn of additional downside risk.
- Some traders watch for capitulation—a final sharp drop or spike in volume—as a sign that selling pressure is nearly exhausted.
- Stocks with strong fundamentals may recover faster after such technical weakness, while those with ongoing challenges could lag longer.
- A confirmed move above the 50 SMA, especially with supporting volume, may signal a short-term reversal and entry point for opportunistic buyers.
- Risk management remains key, as false breakouts can occur and not every move above the 50 SMA leads to a sustained rally.
Strategy Tips for Traders and Investors
Whether you’re an active trader or a longer-term investor, recognizing the implications of stocks below the 50-day SMA can help you manage risk and spot new setups. Swing traders might wait for a high-volume close above the 50 SMA before entering, while value investors could start accumulating shares if fundamentals remain intact. It’s important to use other technical indicators—such as RSI, MACD, or volume analysis—to confirm the strength of any reversal or breakout.
Summary: Balancing Caution and Opportunity
Ultimately, stocks below the 50 SMA for the longest consecutive days are in a technical phase of weakness, but these periods can act as a launchpad for future price appreciation when market sentiment shifts. By watching for supporting signals, using disciplined risk controls, and maintaining a flexible outlook, traders and investors can navigate these setups to uncover compelling opportunities—even when the initial trend appears bearish.