Stocks with highest percentage above 200 SMA - overextension and reversal risk
In technical analysis, the 200-day simple moving average (SMA) is a crucial indicator for assessing long-term stock trends. When stocks trade at the highest percentage above their 200-day SMA, they’re often seen as significantly overextended. This situation can be interpreted as a sign of strong recent momentum, but also as a signal for potential caution, since the market may be overheating and due for a correction.
above200sma
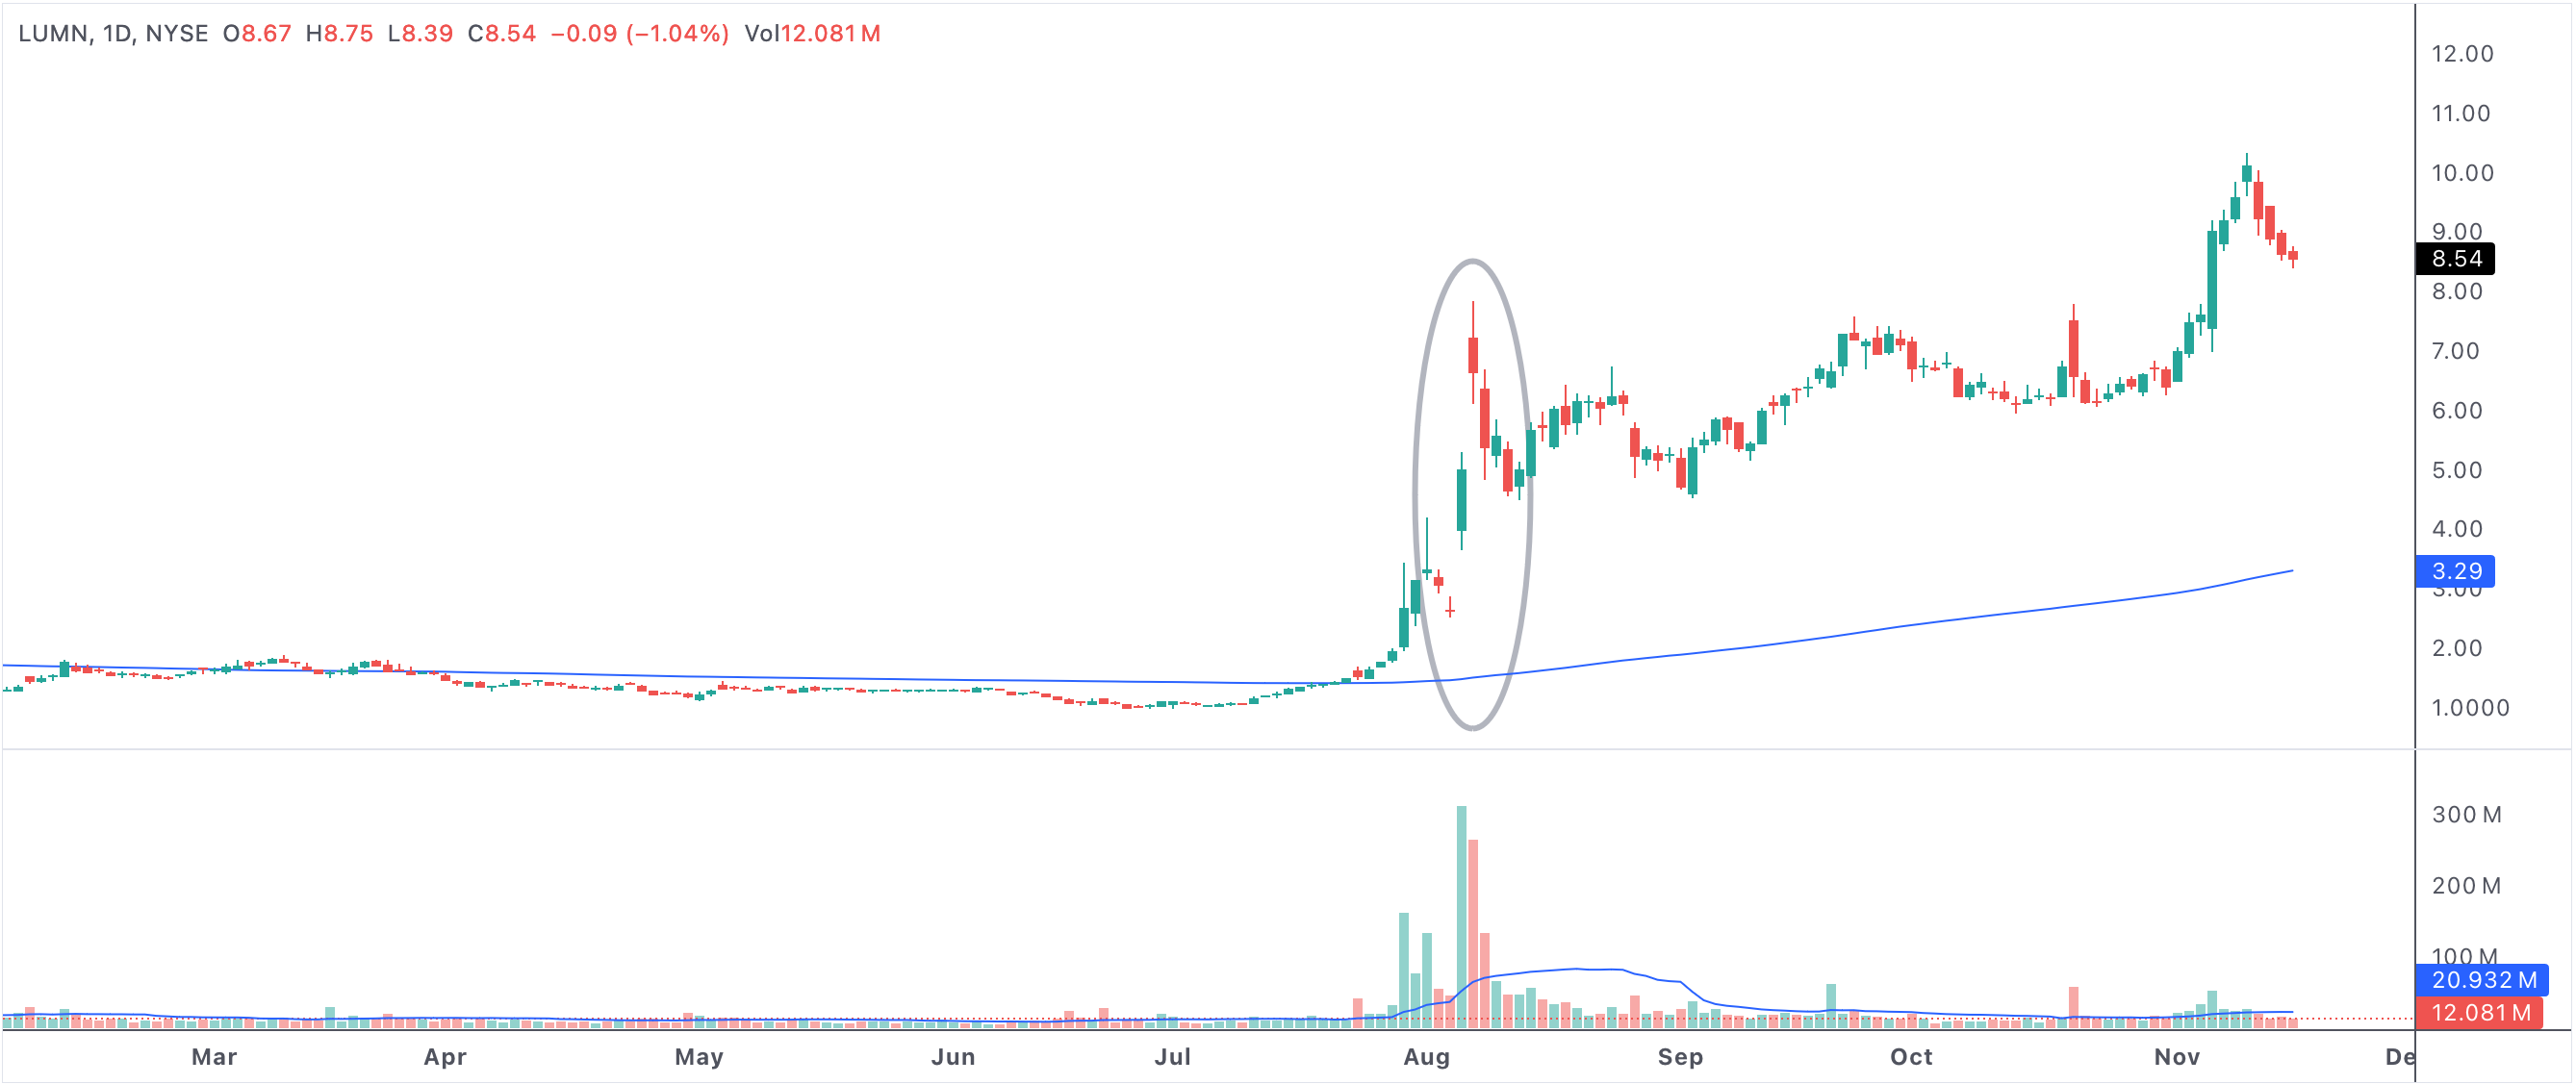
An example of a stock with the highest % above the 200 SMA
Stocks with highest % above the 200 SMA
What Does It Mean When Stocks Are Well Above Their 200-Day SMA?
The 200-day SMA tracks the average closing price over the last 200 trading days, serving as a broad indicator of a stock’s overall direction. When a stock’s price is far above this average, it suggests powerful bullish momentum and investor enthusiasm. These periods often follow strong earnings reports, positive sector trends, or broader market rallies. However, while such surges can signal confidence, they may also point to stocks becoming “overbought,” meaning prices are stretched far beyond typical historical norms.
Market Psychology: From Exuberance to Caution
As stocks push further above their 200-day SMA, more traders and investors may jump in, fearing they’ll miss additional gains. This “fear of missing out” can amplify the rally, pushing prices even higher. Yet, the further a stock climbs above its 200 SMA, the more likely it becomes that early investors will start to take profits, especially if valuations appear disconnected from fundamentals.
Market exuberance can only sustain itself for so long before caution returns. Technical traders watch for overextension, using other indicators—such as the RSI, MACD, or volume spikes—to confirm when momentum is waning.
Profit Taking and the Risk of Reversal
When a significant number of stocks are highly extended above their 200-day SMA, the risk of a reversal grows. Institutional investors may view these levels as ideal for profit taking. Additionally, negative news, earnings disappointments, or shifts in economic sentiment can rapidly reverse bullish trends, leading to sudden and sharp corrections.
- Stocks far above the 200 SMA may indicate a strong rally, but also overvaluation risk.
- Corrections can be triggered quickly as traders lock in gains and selling pressure increases.
- Momentum shifts often accelerate once prices begin to retreat toward the 200 SMA.
- Periods of overextension typically don’t last, as markets tend to revert to their longer-term averages.
- Extended rallies above the 200 SMA are important signals for both opportunity and risk management.
Combining Technical and Fundamental Analysis
While the 200-day SMA is a valuable technical tool, it’s most powerful when used with fundamental analysis. Stocks that are fundamentally strong may remain above the 200 SMA for extended periods, especially in bull markets or when sector growth outpaces the broader market. However, when price gains seem excessive relative to earnings or revenue growth, caution is warranted.
Many experienced traders monitor volume trends, news flow, and macroeconomic data to validate or challenge the signals from SMA-based strategies. When volume dries up or negative headlines emerge, even the most resilient uptrends can falter, pulling prices back toward or below the 200-day average.
Managing Risk When Trading Extended Stocks
Investors spotting stocks with the highest percentage above their 200 SMA should balance optimism with prudent risk management. Setting trailing stops, scaling out of positions, or diversifying portfolios can help protect gains if a correction materializes. Recognizing that high extensions above the 200 SMA are rare and often short-lived is key to staying disciplined during periods of heightened volatility.
In summary, while stocks far above their 200-day SMA can reflect genuine bullish trends, they also serve as a warning that the market may be primed for profit taking or reversal. Smart investors use these signals to fine-tune entries, exits, and risk controls, ensuring they benefit from strong trends while remaining protected from sudden pullbacks.