Stocks with highest percent above 50 SMA - overbought signals and risks
When a stock’s price rises to its highest percentage above the 50-day simple moving average (SMA), it often attracts attention from both short-term traders and long-term investors. The 50 SMA is one of the most widely watched trend indicators in technical analysis, helping to gauge the strength and sustainability of a stock’s recent momentum. But what does it really mean when a stock becomes highly extended above this key moving average? And what risks or opportunities does this scenario present?
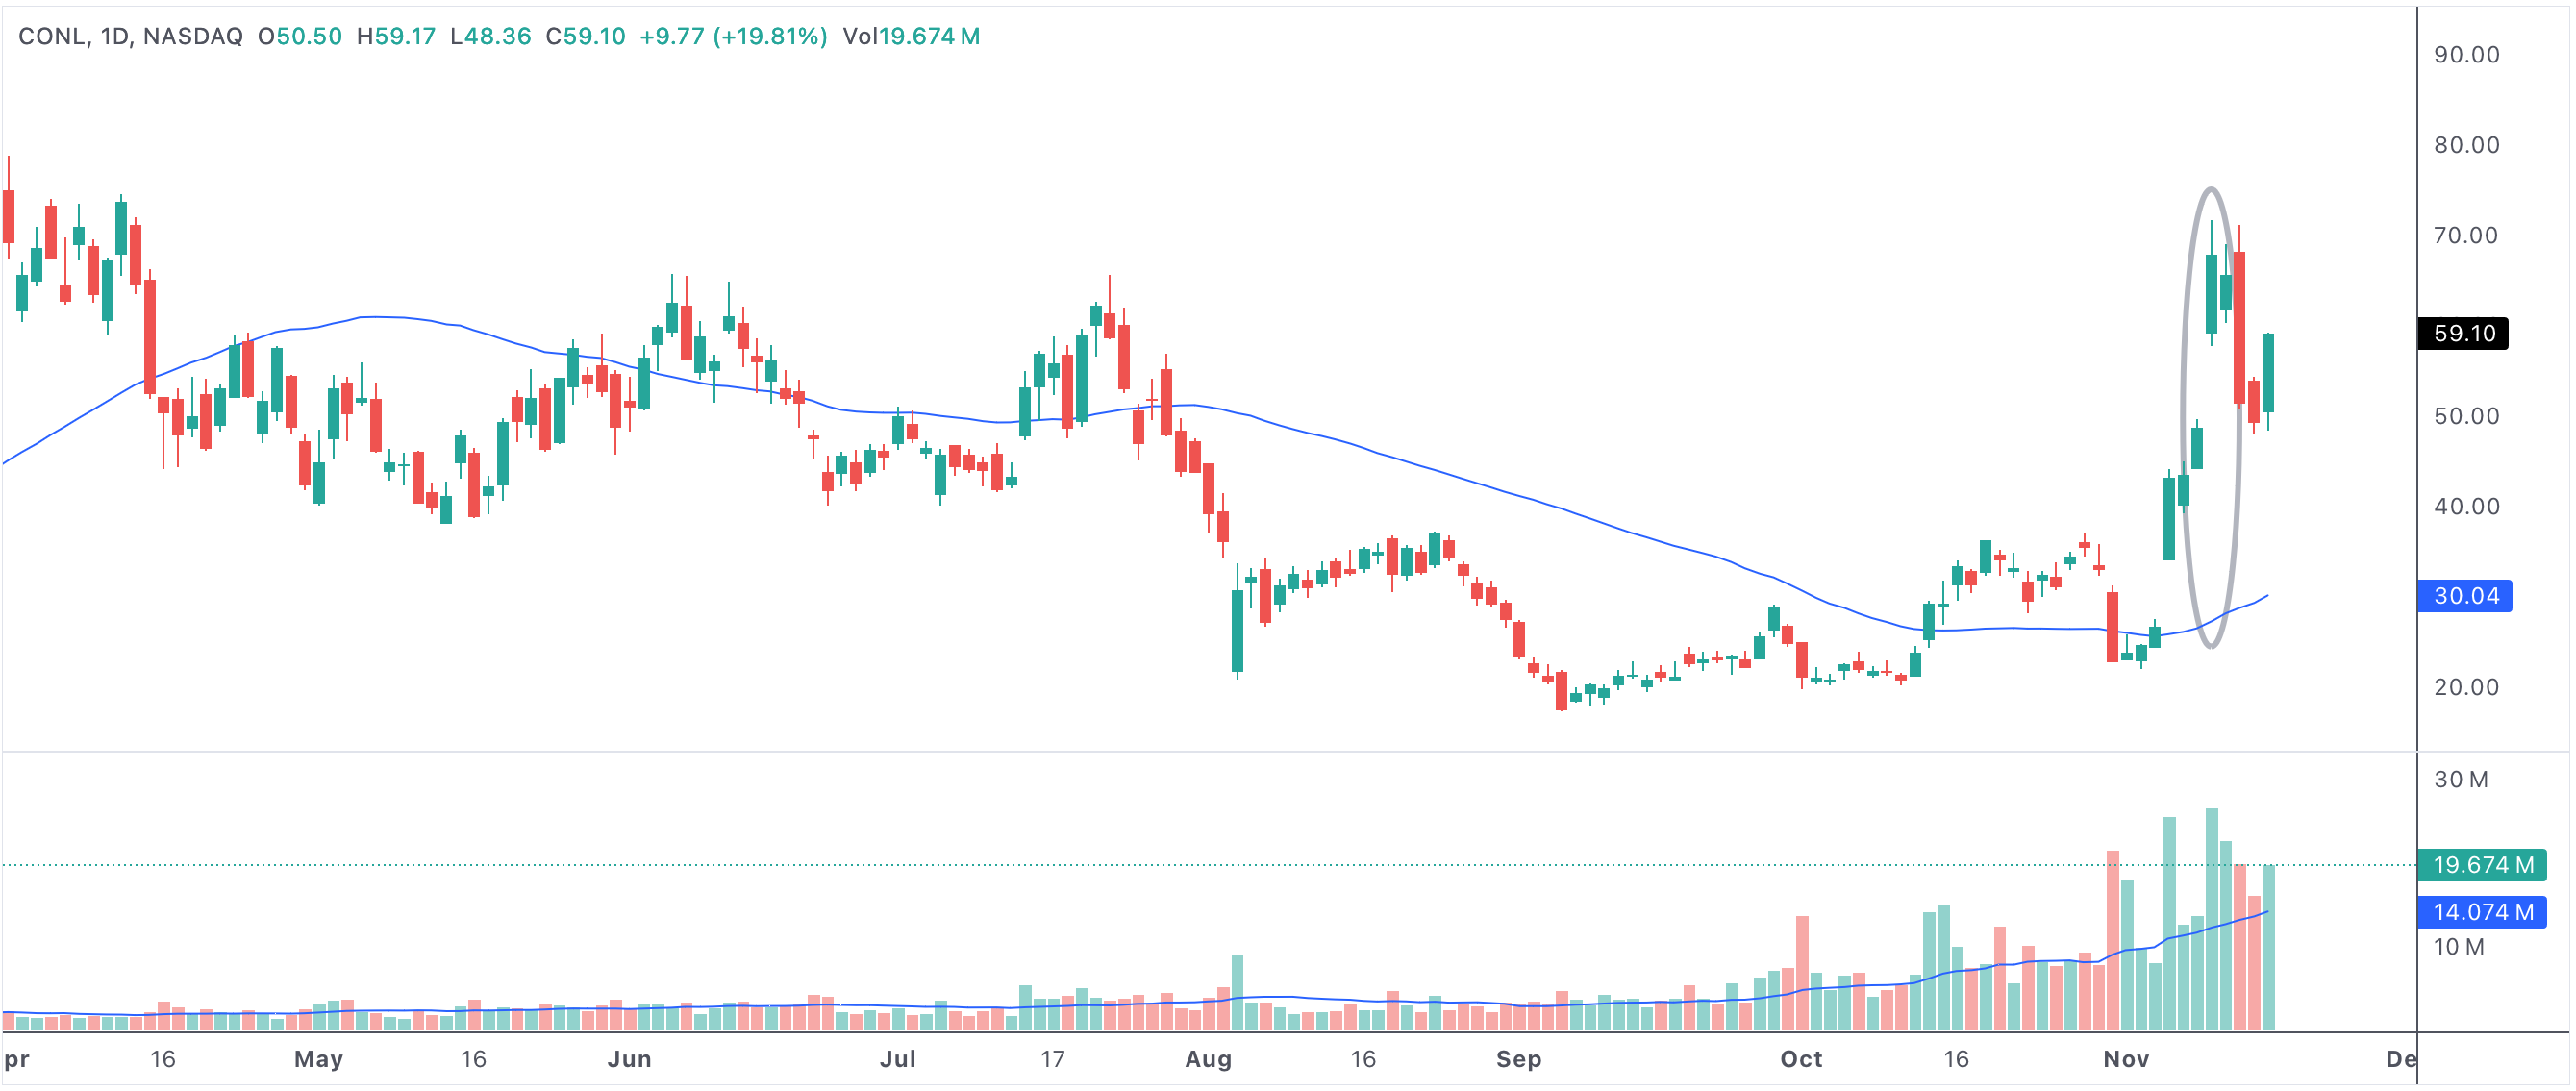
above50sma
An example of a stock with the highest percentage above the 50 SMA
Stocks with highest % above the 50 SMA
What Does It Mean to Be Far Above the 50-Day SMA?
The 50-day simple moving average is a smoothed measure of a stock’s closing price over the past ten weeks. When a stock trades at a high percentage above its 50 SMA, it is considered “overbought” in the short term. This scenario signals that the stock’s recent performance has dramatically outpaced its average, and such momentum may not be sustainable indefinitely. Extreme price extension above the 50 SMA can result from strong earnings, sector momentum, or broad bullish sentiment. However, these stretches often precede a phase of consolidation, profit taking, or even a sharp pullback.
Bearish Risks of Overextension
A stock that is highly extended above its 50-day SMA can become vulnerable to sudden reversals. When many stocks in the broader market or a sector reach these levels, it can signal exhaustion of buying pressure. Technical traders often view this as a time to lock in gains, as the risk of a retracement increases. If macroeconomic indicators or company fundamentals do not support the rally, investors may question whether prices can stay elevated. In these cases, negative news, weaker-than-expected earnings, or a shift in sentiment can trigger a swift move back toward the mean.
- Significant extension above the 50 SMA often signals short-term overbought conditions.
- Sharp rallies can be fueled by speculative buying, but these moves are rarely sustainable without strong fundamentals.
- When stocks reverse, profit taking and momentum selling can quickly drive prices back toward support levels.
- Technical traders may use this scenario as a signal to tighten stops, take profits, or even initiate short positions.
- Market pullbacks often begin when a large percentage of stocks are highly extended above their 50 SMAs simultaneously.
How Traders and Investors Use This Signal
Many active traders scan for stocks with the highest percent above the 50 SMA to find potential short-term reversals or mean reversion setups. These stocks may be poised for a breather after a strong rally, especially if momentum begins to wane or volume starts to decline. Longer-term investors might see these extensions as signals to review their positions, rebalance portfolios, or simply avoid buying at elevated levels. It’s crucial to consider other indicators—such as RSI, MACD, or overall market sentiment—to confirm the likelihood of a reversal.
When Is It Not a Bearish Signal?
While a high percent above the 50 SMA is often a warning sign, there are exceptions. If a stock is experiencing a breakout from a long consolidation phase, or if fundamentals have materially improved, the price can remain extended for longer than expected. In bull markets, strong momentum can carry stocks higher and keep them above moving averages for months. However, even in these cases, buying at such extended levels often increases risk and reduces the margin for error.
Summary: Balancing Opportunity and Caution
In summary, stocks with the highest percentage above their 50 SMA often reflect powerful bullish momentum but also come with heightened risk of a pullback or reversal. By paying attention to this signal, traders and investors can better manage entries and exits, reduce the risk of buying at the top, and capitalize on opportunities when the inevitable mean reversion takes place. Always use sound risk management and confirm signals with additional analysis before making trading decisions.