Stocks With Highest Percentage Below 50 SMA - Bullish Reversal Signals
When a significant percentage of stocks trade well below their 50-day simple moving average (SMA), the market is often described as being in an oversold state. This technical condition is closely monitored by traders and investors, as it can signal the end of a short-term downtrend and the start of a potential market rebound. While it might initially seem like a negative sign, many seasoned investors interpret this widespread weakness as an opportunity to identify stocks poised for a recovery.
below50sma
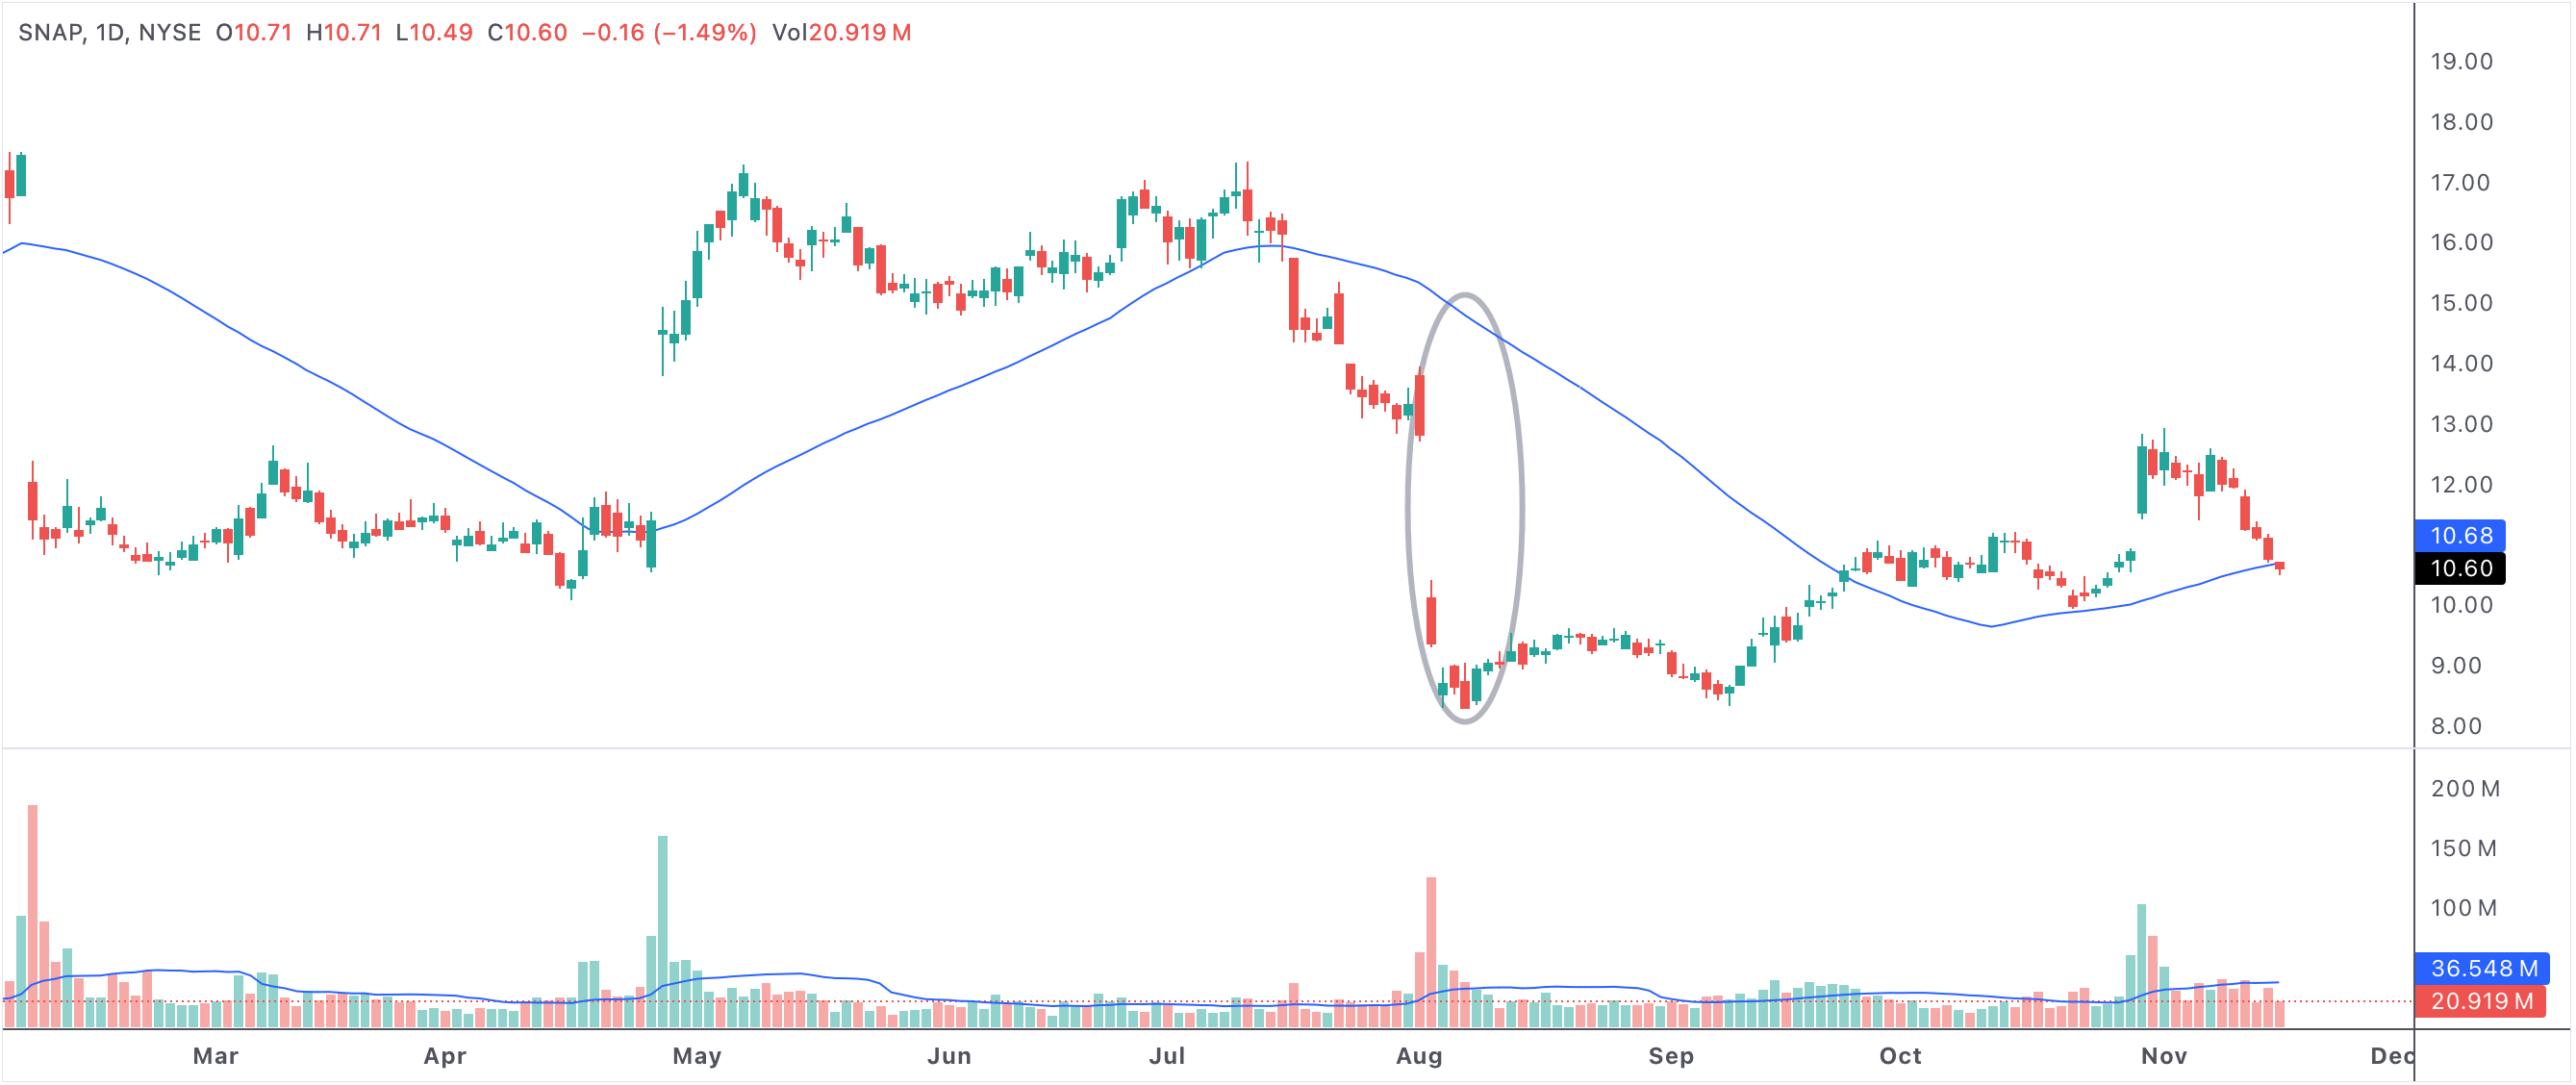
An example of a stock with a highest % below the 50 SMA
Stocks with highest % below the 50 SMA
Why the 50-Day SMA Matters
The 50-day simple moving average is one of the most commonly used technical indicators in the stock market. It reflects the average closing price over the previous 50 trading days and acts as a gauge for the intermediate-term trend of a stock or index. When stocks fall below their 50 SMA, it often means that recent momentum has turned negative. However, if a large number of stocks are below this level at the same time, it can be an indication of extreme pessimism and a potential oversold market.
Oversold Markets and Short-Term Opportunities
A market where the majority of stocks are trading beneath their 50 SMA can present excellent opportunities for those seeking to buy low. Such conditions often occur during market corrections or after significant negative news. Investors looking for short-term reversals may see these periods as ideal times to search for quality stocks that have been unduly punished, especially if underlying fundamentals remain strong.
- Oversold signals can attract buyers who anticipate a bounce back toward the 50 SMA.
- Short-term traders may look for technical patterns or volume spikes indicating reversal potential.
- Stocks rebounding above their 50-day average can trigger further momentum buying.
Institutional Activity and Market Psychology
Large institutional investors and hedge funds also monitor the percentage of stocks below the 50 SMA to gauge overall market health. When this percentage is high, it can indicate that selling has reached capitulation levels. At this point, institutions may start accumulating positions in fundamentally strong companies, which can provide support to the market and help drive prices higher as confidence returns.
- Capitulation events often precede major reversals in trend, especially in the short term.
- Institutional accumulation at oversold levels can help spark rallies and restore market confidence.
Key Signs of a Reversal
While a high percentage of stocks below the 50 SMA can suggest an oversold market, traders often wait for additional confirmation before entering positions. Key reversal signs include increasing volume on up days, bullish candlestick patterns, and major indexes stabilizing above recent lows. As more stocks begin to reclaim their 50 SMA, bullish sentiment can spread quickly, creating a powerful momentum shift.
Combining Technical and Fundamental Analysis
It’s important to note that while technical indicators like the 50 SMA provide valuable information about market trends and sentiment, they are most effective when used in combination with fundamental research. Investors should look for companies with strong earnings, solid balance sheets, and positive growth prospects, as these stocks are more likely to lead a rebound when market conditions improve.
Summary: Spotting Opportunity Amid Weakness
In summary, a high percentage of stocks below their 50-day simple moving average signals a market that may be oversold and ripe for a reversal. By recognizing these conditions and watching for supporting technical signals, traders and investors can position themselves to take advantage of short-term rebounds and potential longer-term trend changes. For those with a disciplined approach, periods of broad market weakness can offer some of the best opportunities for outperformance.