Two consecutive bearish candles with the second candle as an inside day
The “Redredinside” pattern, defined as two consecutive bearish candles followed by an inside day, is a candlestick formation that technical traders closely watch for its unique signal of market transition. While its initial appearance—two red candles—suggests persistent selling, the emergence of an inside day after this sequence is often a subtle, early sign that the bearish momentum may be losing steam. Recognizing and interpreting this setup can offer traders and investors a potential edge, especially when the pattern occurs at or near established support levels, or after a sharp downtrend.
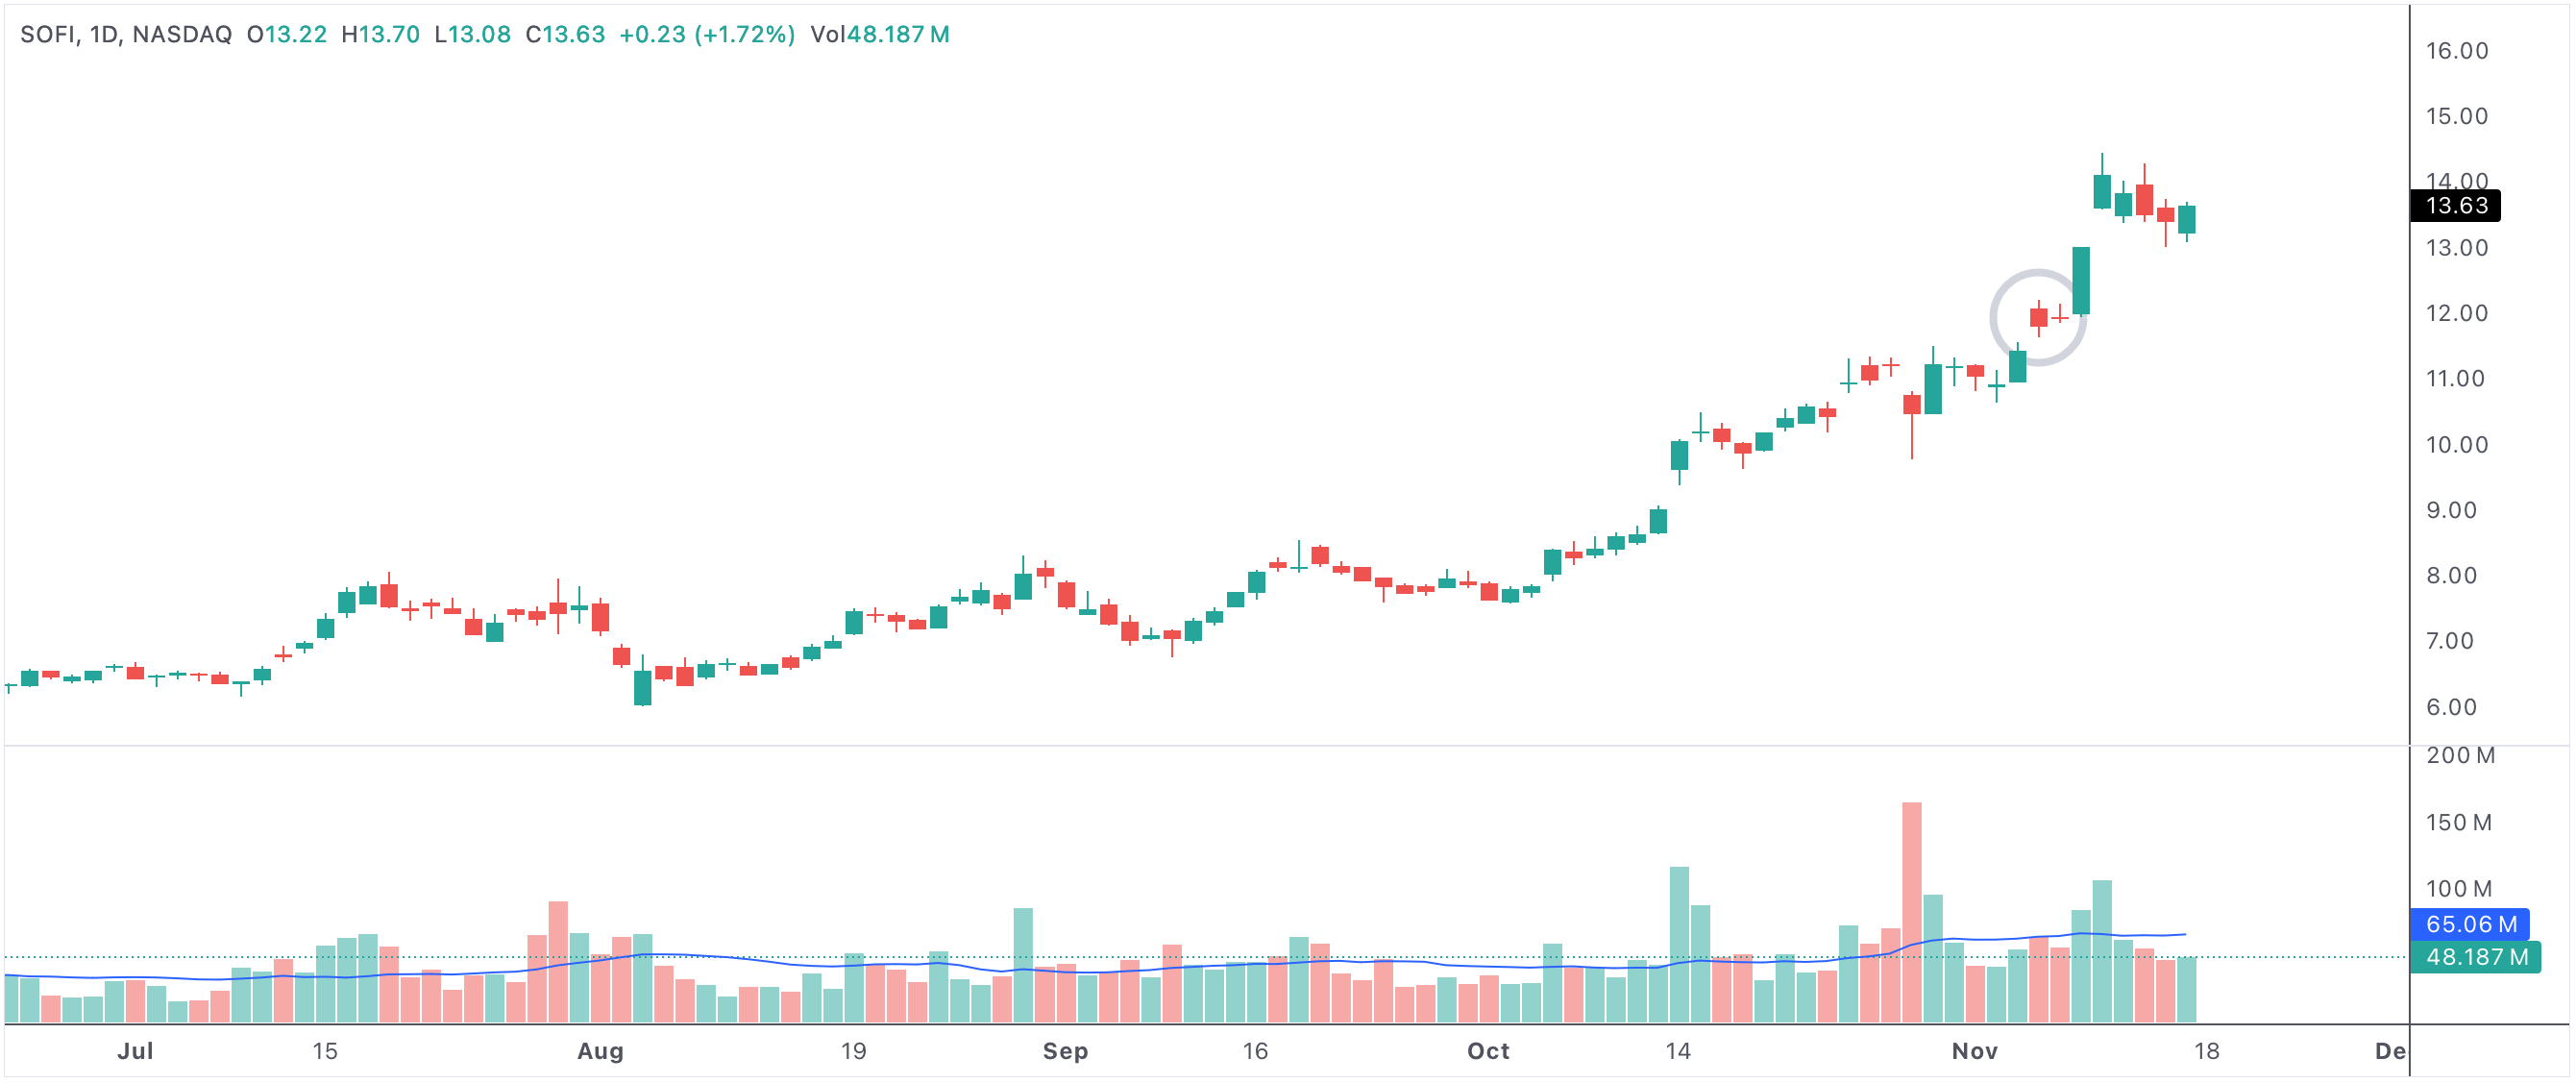
redredinside
An example of a stock with two consecutive bearish candles followed by an inside day, often called the “Redredinside” pattern
Two consecutive bearish candles with the second candle being an inside day
What is the Redredinside Pattern?
The Redredinside pattern features two back-to-back bearish candles, where each candle closes lower than it opens, followed by a third candle whose high is lower than the prior high and whose low is higher than the prior low—forming the inside day. This inside day signals price contraction and indecision, with neither sellers nor buyers willing to push price outside the previous day’s range. The reduction in volatility is a key feature, often marking a period of consolidation before a new directional move.
Bullish Implications: Weakening Selling Pressure
Despite its bearish setup, the Redredinside can actually be an early bullish signal. Why? The two red candles indicate strong selling pressure, but the inside day represents a pause or slowdown in that selling. When this pattern forms near a significant support level, it may suggest that sellers are exhausted and that buyers are quietly stepping in, absorbing available supply. This shift in momentum is often confirmed by subsequent price action—a bullish candle breaking above the inside day’s high can be a powerful reversal cue.
How to Trade or Use the Redredinside Pattern
Many traders use the Redredinside pattern as a setup for a Bullish Harami play, waiting for a break above the inside day as confirmation before entering a long position. Others watch for volume increases or additional bullish indicators (like RSI divergence, MACD crossover, or proximity to a major moving average) for extra confirmation. The pattern is especially effective:
- Near or at established support, where previous buyers may return
- After extended downtrends, where selling may be overdone
- During oversold technical conditions, which can attract contrarian buyers
Risk is typically managed by placing a stop below the inside day’s low, ensuring limited downside if the pattern fails.
Redredinside vs. Other Candlestick Patterns
The Redredinside is closely related to the classic Bullish Harami and Inside Day reversal setups, but its distinct sequence—two bearish candles before the inside day—often marks more extreme bearish sentiment that is ripe for reversal. While not every Redredinside leads to a rally, the pattern is considered more meaningful when found at key technical junctures, such as multi-month lows, the bottom of a trading range, or after an exhaustion gap.
Market Psychology Behind the Pattern
The psychology behind the Redredinside formation is a battle between persistent sellers and cautious buyers. The inside day is the battleground—sellers hesitate to press lower, and buyers begin to test the waters. If the following session sees a move above the inside day’s high, it’s often a sign that bulls are gaining control, and the market may be primed for a momentum shift to the upside.
- Redredinside marks two bearish candles with a consolidating inside day, signaling possible change.
- Look for this pattern near support or after a strong downtrend for bullish reversal potential.
- Breakout above the inside day high is considered bullish confirmation.
- Can be combined with volume or other technical tools for greater accuracy.
- Ideal for traders seeking early entry before full momentum shift.
In summary, while the Redredinside may appear bearish at first glance, its real power is as a Bullish Harami-style reversal pattern—especially near support, after a steep decline, or when paired with other bullish signals. Savvy traders watch for this subtle shift in momentum, ready to act when the first signs of buyer strength emerge.